What It Shows
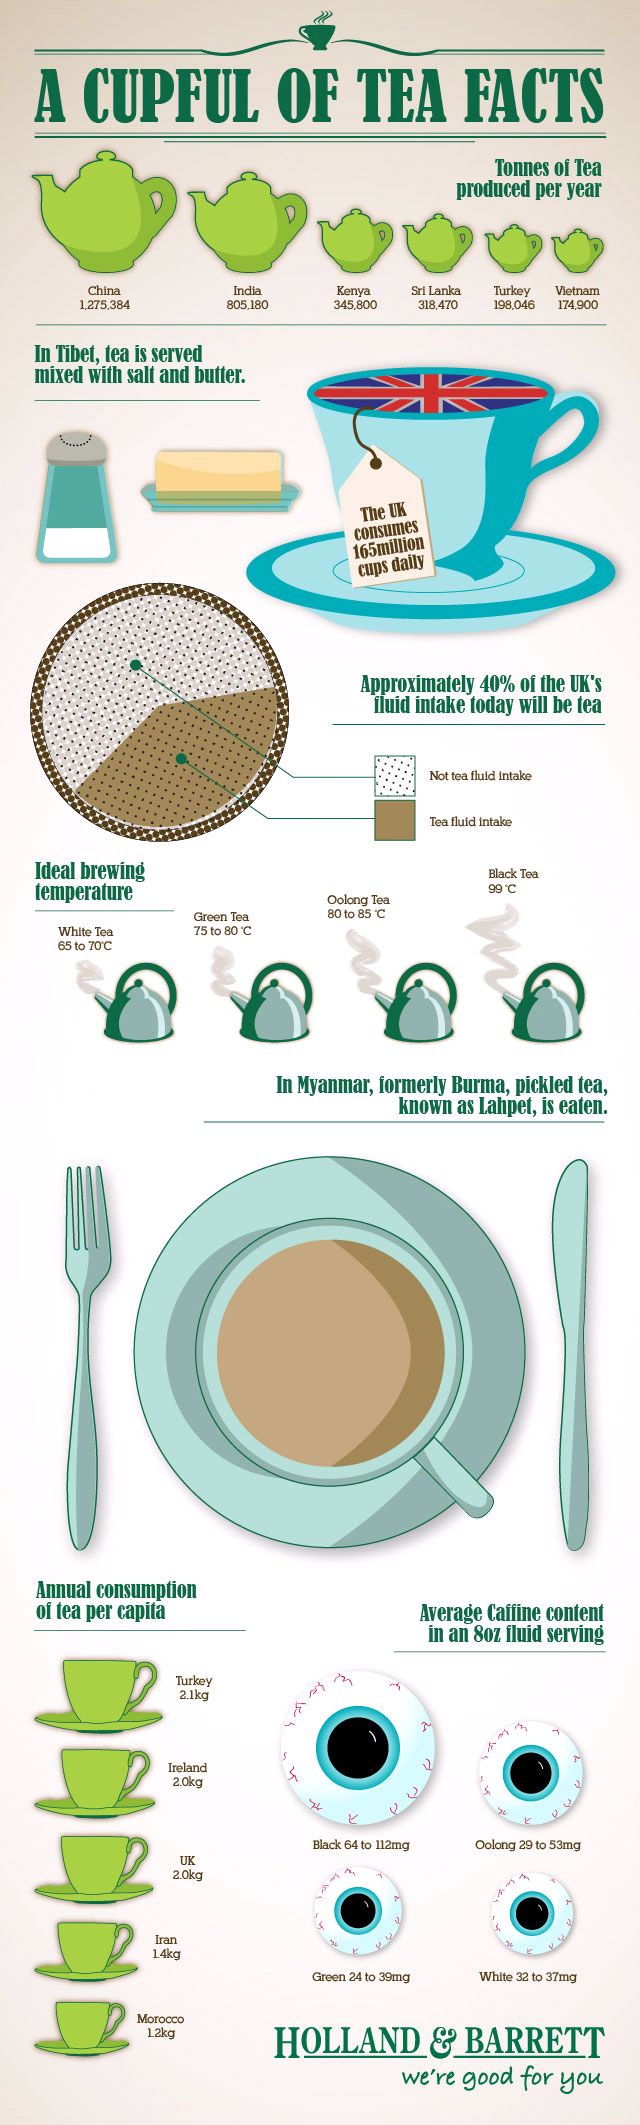
This infographic outlines a variety of tea facts, but with bit of a UK focus.
Why It’s Good
The artwork isn’t mind-blowing, but it is cute. The freaky caffeine eyeballs were jarring at first, but I kind of like them, and am not sure what I would do to represent scale there instead.
What It’s Missing
As always, I’m only so-so about stat-based infographics. I could have done with a few more stats, but at least it wasn’t as confusing as the last tea one I reviewed.
Also, I think some proofreading could have helped. “In Myanmar, formerly Burma, pickled tea, known as lahpet, is eaten.” How about “People in Myanmar (formerly Burma) eat pickled tea, called ‘lahpet'” Something like that. Spelling on ‘caffeine’, too.
This infographic is available at Holland & Barrett here.