Archive for category Society & Culture
Indo-European Language Tree
Posted by Simon in Society & Culture on May 17, 2010
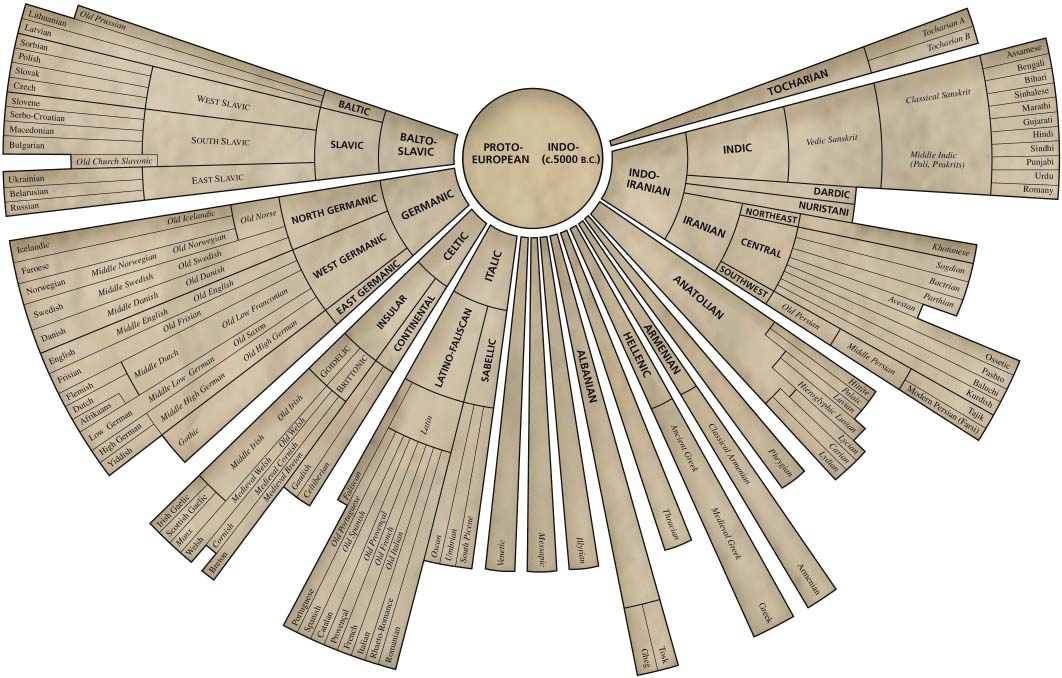
What It Shows
This infographic shows the structure of the spread of all languages derived from the same Indo-European protolanguage.
Read the rest of this entry »
The Five Stages of Your Life (Worm Miller & Marek Haiduk)
Posted by Simon in Society & Culture on May 13, 2010
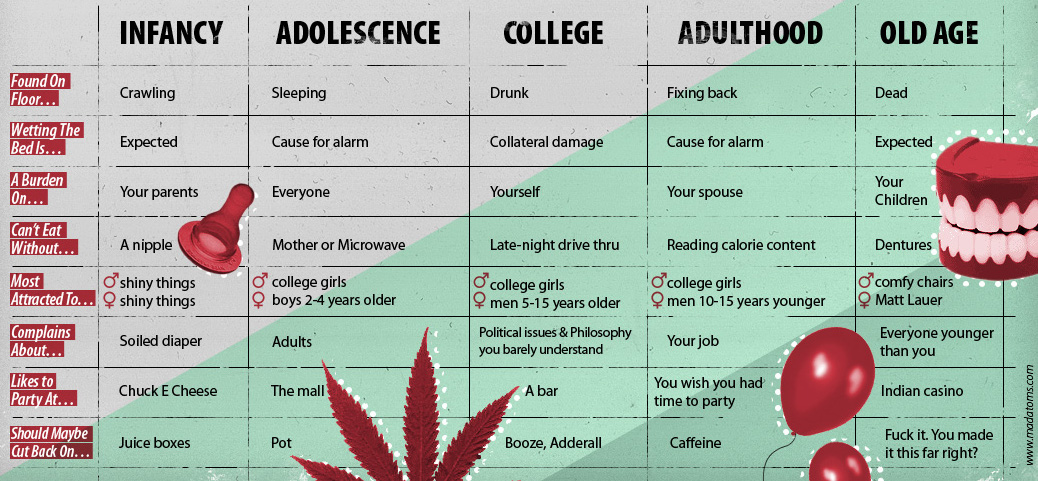
What It Shows
This infographic is a humourous grid breakdown of different aspects of life depending on what stage of your life you’re in: Infancy, Adolescence, College, Adulthood, and Old Age. These aspects are presented as beginnings of phrases (eg. “A burden on…”), and the phrase is completed differently depending on the life stage in question.
Read the rest of this entry »
Ever Gotten a Date Online? (Online Schools)
Posted by Simon in Science, Technology, & Internet, Society & Culture on May 6, 2010
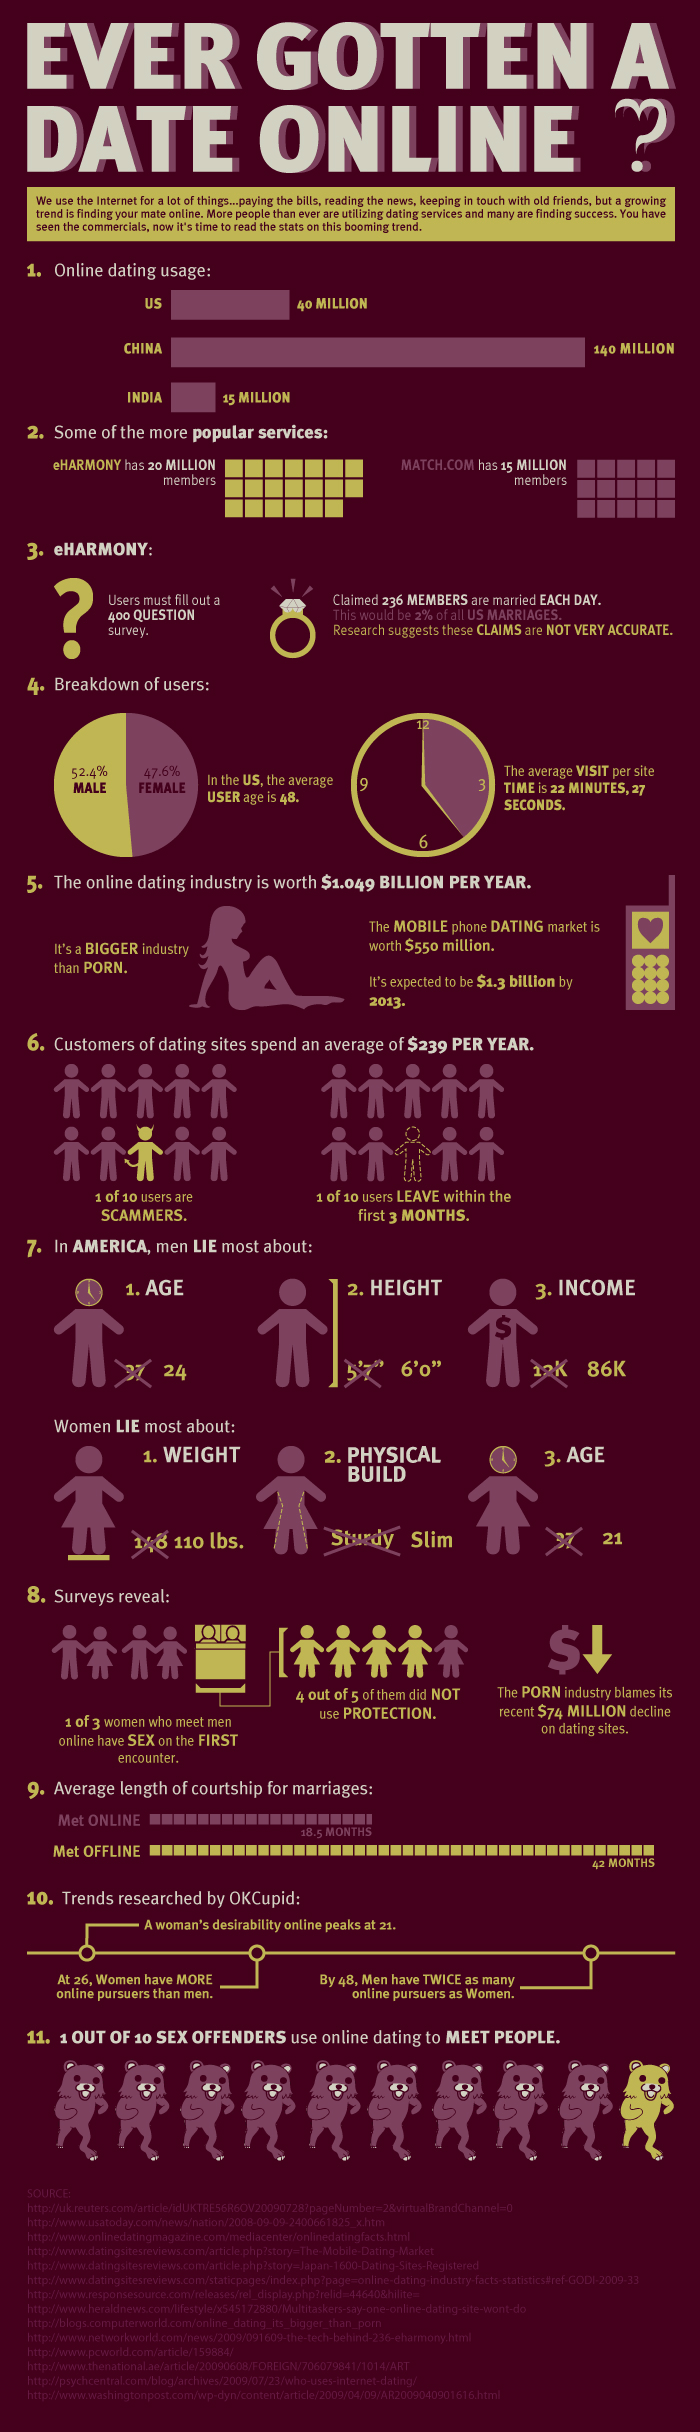
What It Shows
This infographic is a collection of statistics and information about the current online dating industry: who takes part, how many, and what they do.
Read the rest of this entry »
Celebrity Body Insurance (Free Insurance Quotes)
Posted by Simon in Money, Society & Culture on April 29, 2010

What It Shows
This infographic shows which celebrities have insured which parts of their body, and for how much. While the rest of us are getting auto insurance and health insurance, these celebrities are insuring everything from mustaches to tastebuds.
Read the rest of this entry »
Left vs Right (David McCandless & Stefanie Posavec)
Posted by Simon in Politics, Society & Culture on April 15, 2010
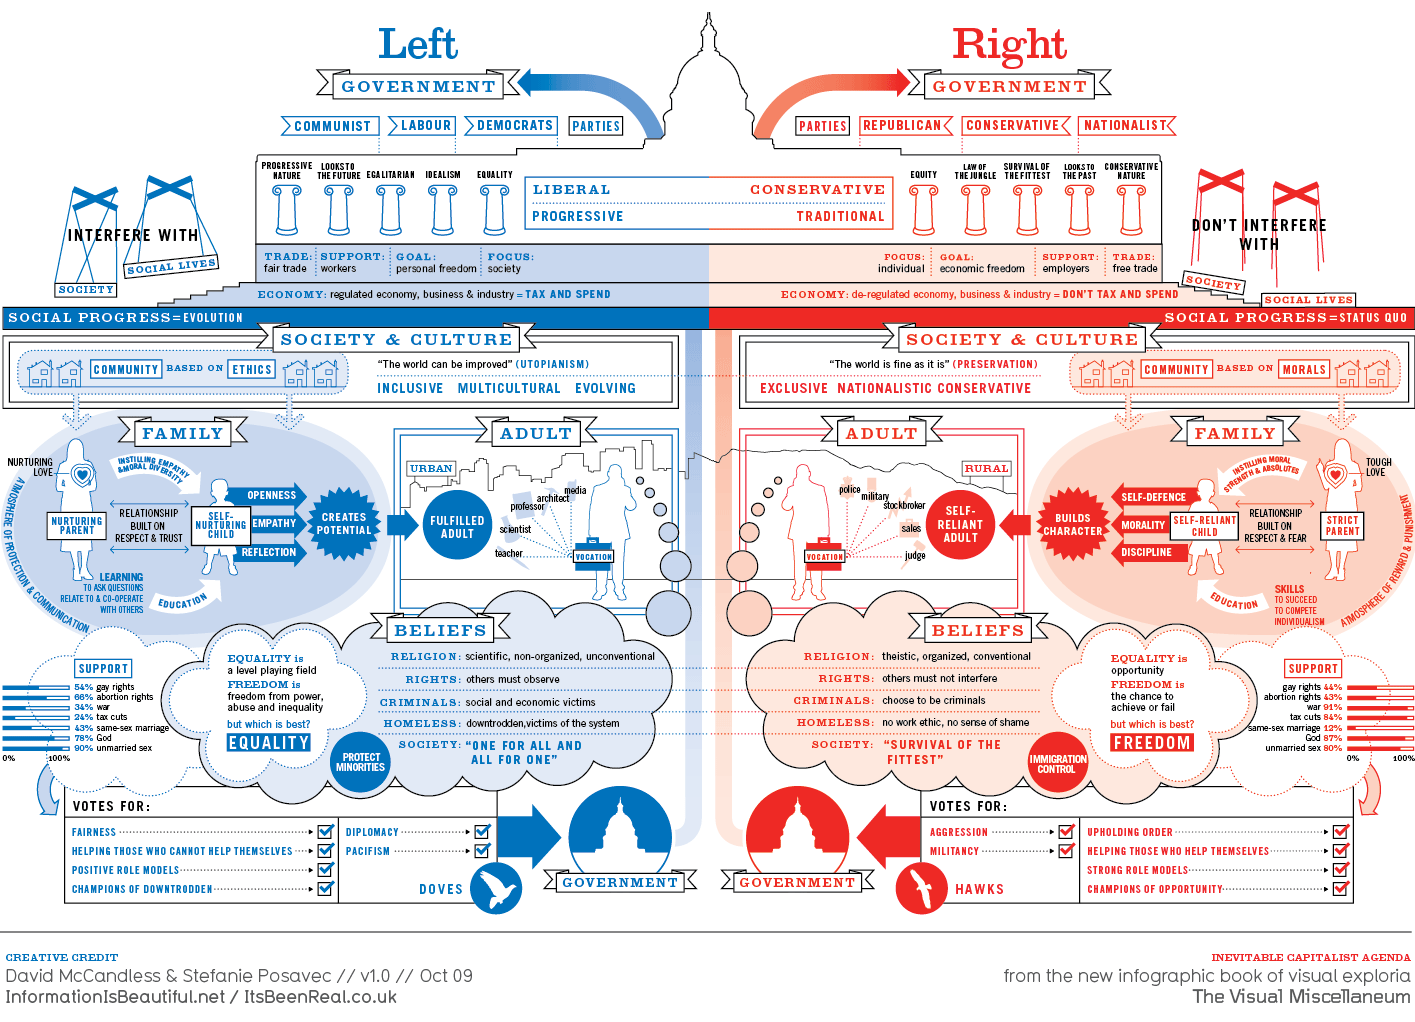
What It Shows
This infographic is a supremely comprehensive breakdown of left vs right (liberal vs conservative) thinking, covering politics, society, culture, family, and beliefs. For every element, views are compared and contrasted in a massive mirror image attempt.
Read the rest of this entry »
Canada’s Most Visited Attractions (Canada 411)
Posted by Simon in Society & Culture on April 12, 2010

What It Shows
This infographic lists the top areas and attractions in Canada, ordered by number of yearly visits.
Read the rest of this entry »
Teen Pregnancy in America: Facts & Statistics (Online Ultrasound Schools)
Posted by Simon in Health & Safety, Society & Culture on April 1, 2010
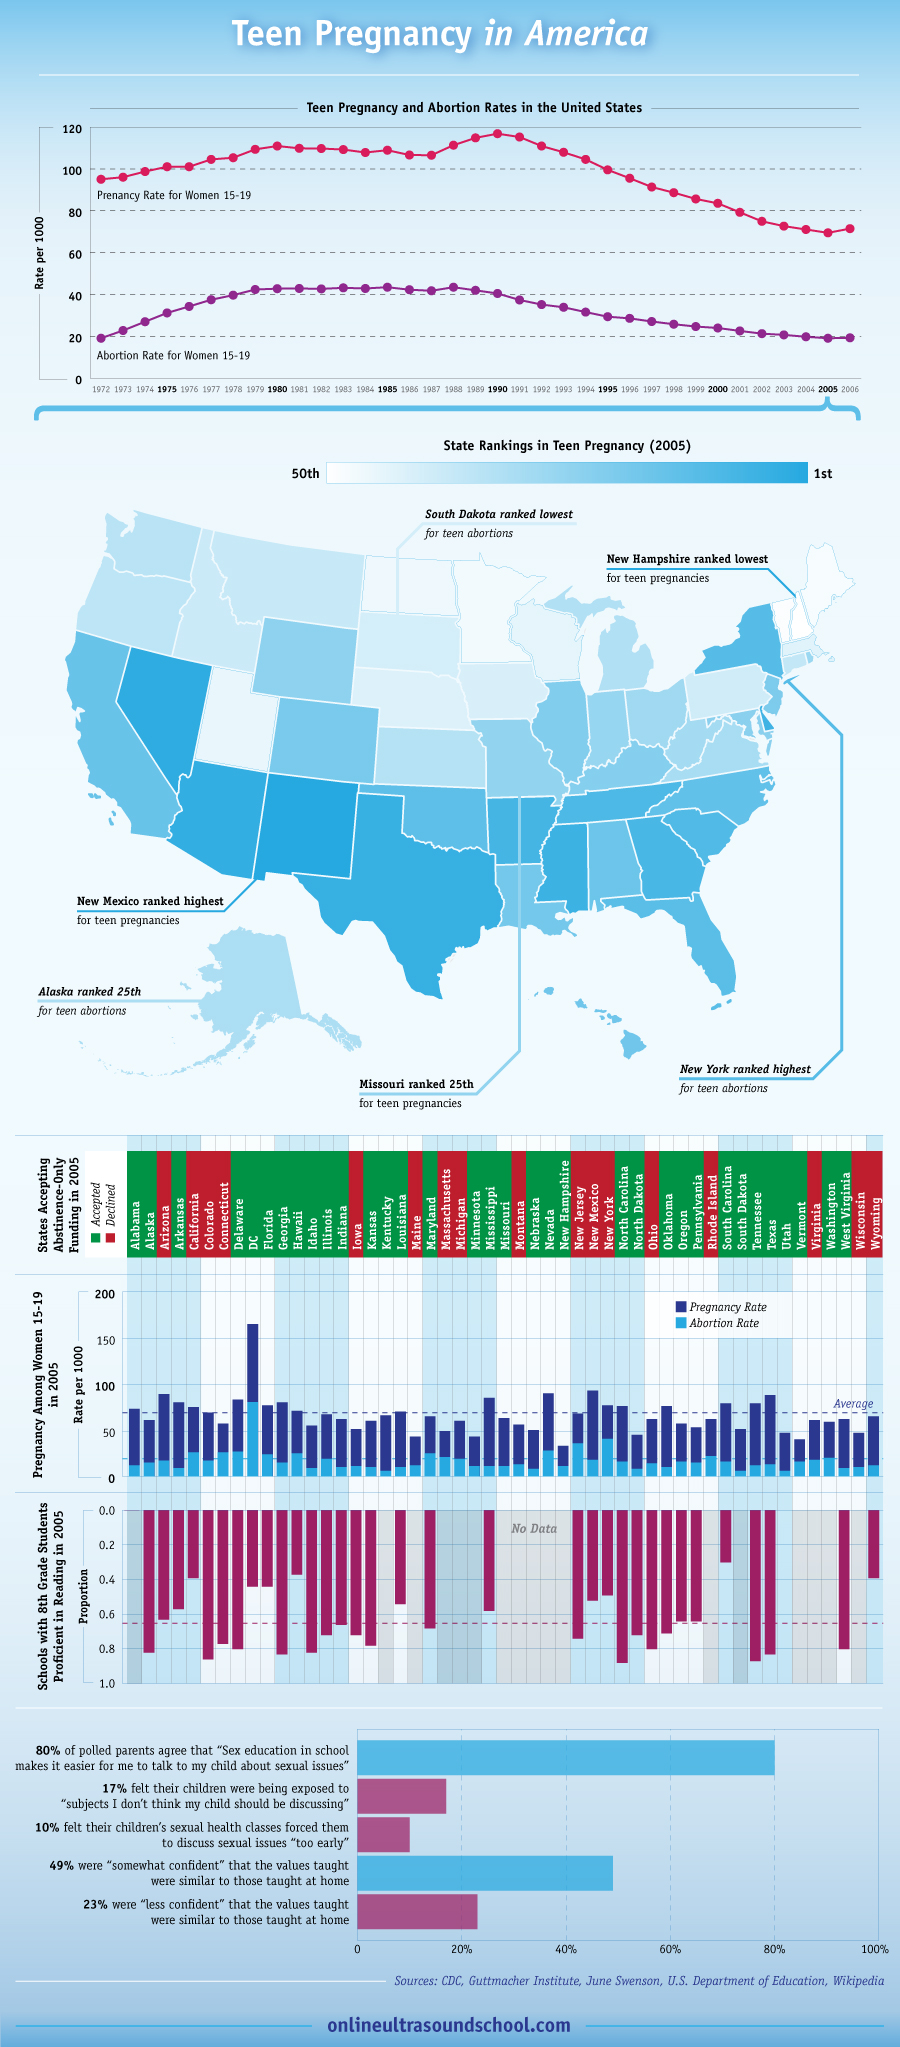
What It Shows
This infographic shows a collection of nationwide and state-level statistic on teen pregnancy and abortion rates in America. The map of America with different states highlighted by teen pregnancy rate rank gets more quantified in more detail in the graph below it.
Read the rest of this entry »
College in America (Online Colleges and Universities)
Posted by Simon in Society & Culture on March 29, 2010
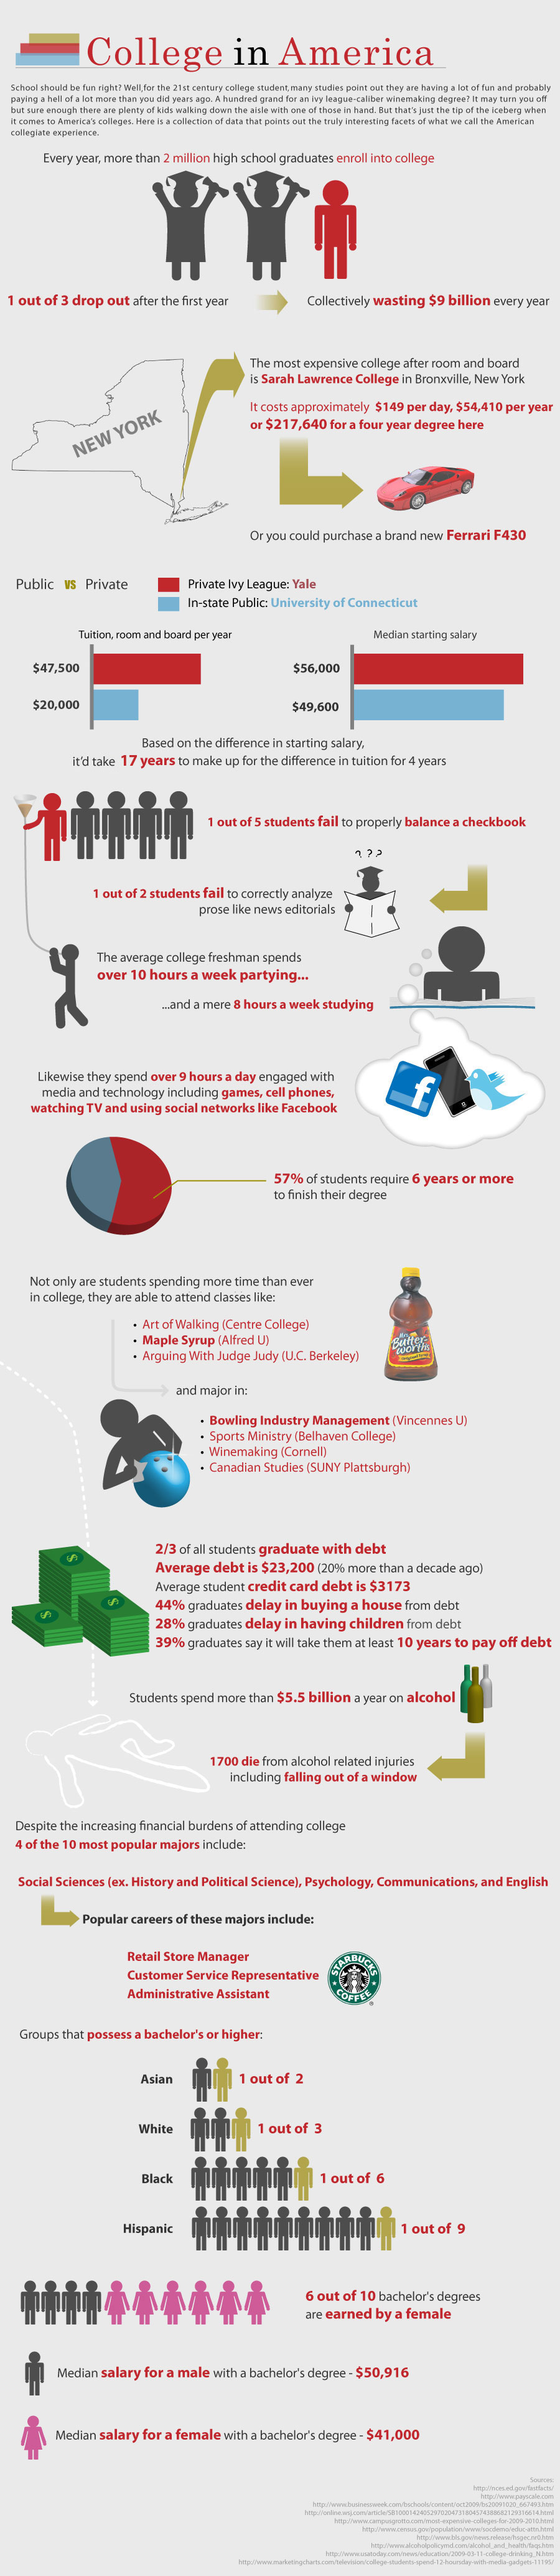
What It Shows
Presented and discussed at FastCompany, the infographic gives a breakdown of statistics designed to encourage a person to question the value of going to college in America.
Read the rest of this entry »
Flower Power: February’s Booming Floral Economy (Mint)
Posted by Simon in Money, Society & Culture on March 18, 2010
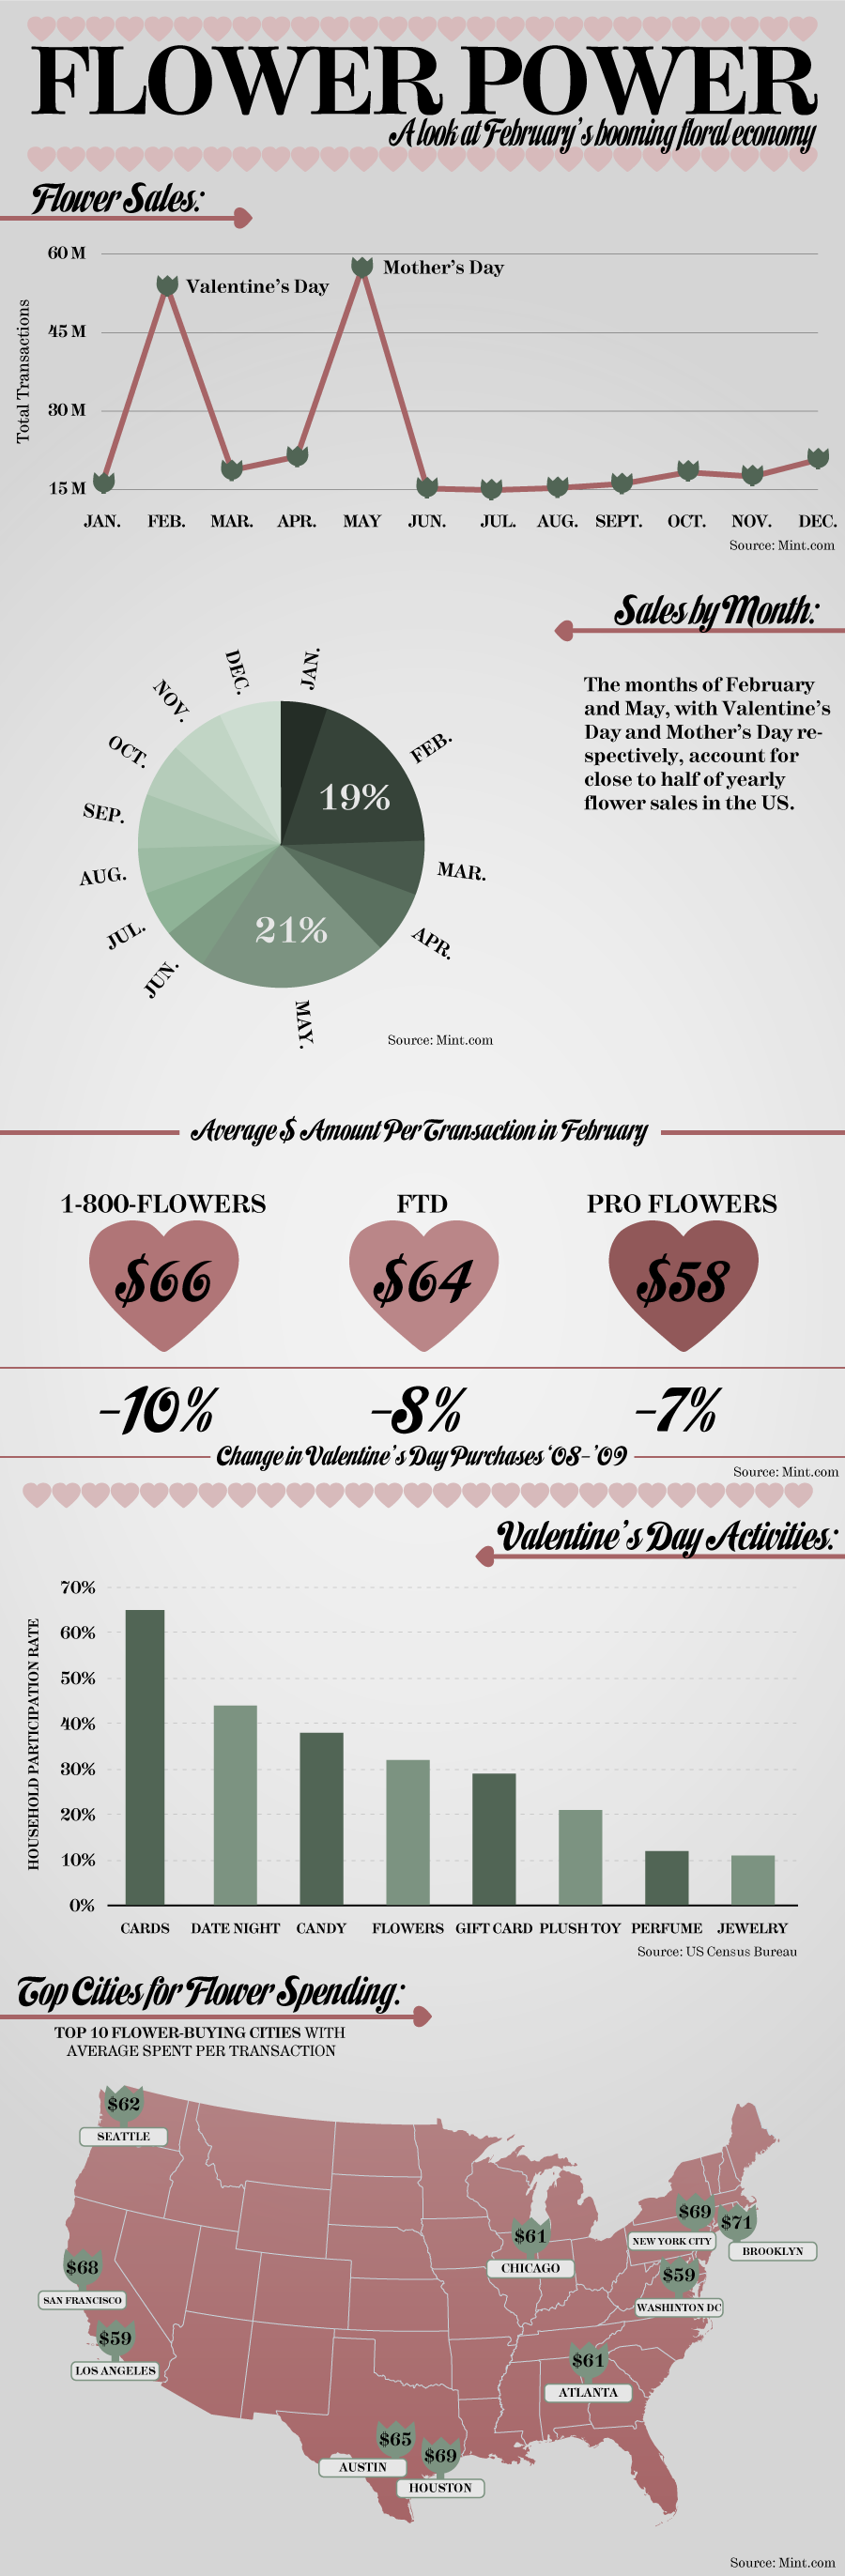
What It Shows
This infographic shows flower-related holiday activity, essentially showing the size of the Valentine’s Day and Mother’s day spikes, and how flowers and flower delivery compare to other purchases.
Read the rest of this entry »
Picturing the Past 10 Years (Phillip Niemeyer at the New York Times)
Posted by Simon in Society & Culture on January 10, 2010
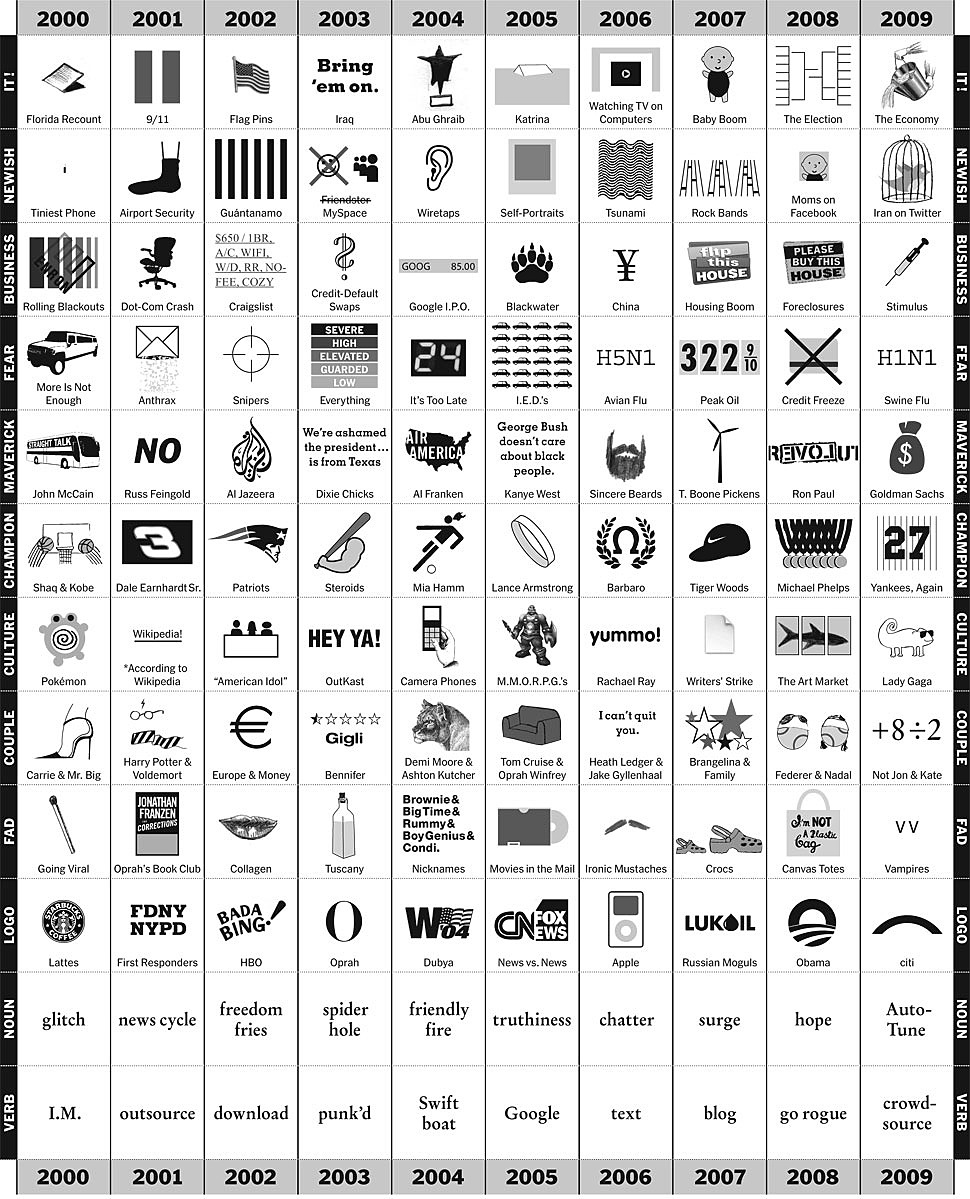
What It Shows
This America-focused infographic recaps the decade with a table in which the columns are years and the rows are themes, including “couples”, “noun”, “business”, and much more. It’s a summary of the major people and events of the last ten years in a simple but information filled layout.
Read the rest of this entry »