What It Shows
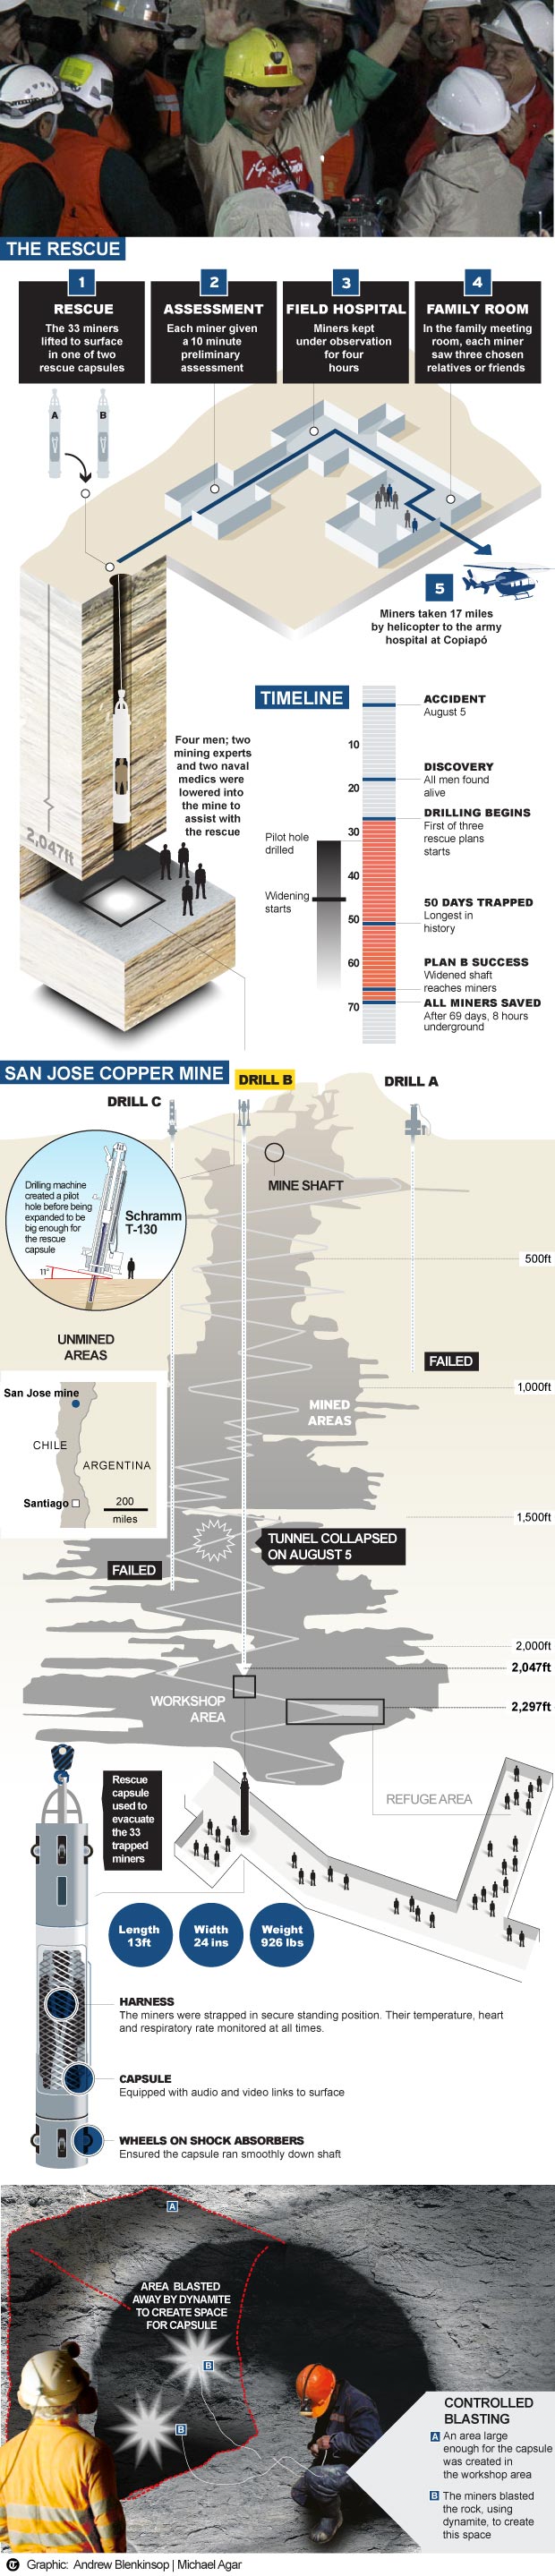
This infographic explains the steps, successes, and failures of the rescue of the miners in Chile in the late summer of 2010. I realize I’m somewhat late with this infographic, but I still like it, and just because a story isn’t fresh news doesn’t mean it’s not worth learning about or remembering.
Why It’s Good
It’s easy to learn a lot from this infographic, and I believe that someone with little to no knowledge of the event could come away from it with a good understanding of how it transpired.
While there’s no oustandingly insightful display of information, the art serves to make it interesting, make it feel more real. In particular, I like the map of the mineshaft itself, giving relative insight into the failed drilling attempts.
Extra details, like the type of drilling machine used, and the breakdown of the rescue capsule’s wheeled shock absorbers and safety harnesses show well-executed infographic effort, and they managed to not overcrowd the visual space in the process.
What It’s Missing
I was a bit confused at the outset at the starting 4 steps. With an infographic about the rescue, I expected reading down to match the chronology of the event, and I found it odd to open with 4 steps where only step 1 is the whole rescue, which I wanted to get into right away.
In truth, the story ends at the surface, and I like that the story elements are told next to the places in the map where they occurred, so it’s not so bad. I still felt disoriented early on, though.
While I get it now, the timeline took a bit of figuring out, and could have been easily remedied. If, for example, the “10” was changed to “Day 10″ or “10 Days”, it would have been clearer.
The image at the bottom of the area where the miners blasted is a bit strange, and I’m not sure what to make of it. There seems to be some attempt at three-dimensionality, but I can’t figure out the shape it’s trying to depict.
Overall, a nice, professionally assembled, and rather comprehensive set of facts for what was, thankfully, a happy ending.
This infographic was found on the Telegraph newspaper’s site here.