Welcome to Infographics Blog! On this site you will see a wide variety of forms of data visualization. Some are funny, some are cool, some are interactive, and some are animated. All are reviewed along with explanations of the strong and weak points of the given infographic: how they handle aesthetics, data selection and presentation, how clever they are, and more.
Enjoy the best and worst of the infographic world, and feel free to leave a comment!
China Global Investment Tracker Interactive Map (Heritage.org)
![]()
What It Shows
This interactive infographic combines various aspects of China’s interaction with the global economy, showing its investments and activities in numerous sectors: metals, industry, transportation, real estate, agriculture, power, finance, energy, and technology. From this, interesting strategic perspectives emerge. Also included are per-country specifics across these areas, and how they connect to China with a mini profile tracking recent years.
Key take home points are China’s massive input and thus control of American debt, while actually investing in pretty much everyone but the United States in the other sectors. Very interesting.
Read the review of this infographic »
The Growth of Walmart & Sam’s Club (Flowing Data)

What It Shows
This video infographic tracks the expansion of Walmart by mapping the opening of stores over time.
Read the review of this infographic »
Survival in the Event of a Zombie Attack (Z.E.R.O.)
Posted by Simon in Health & Safety on August 25, 2011

What It Shows
This infographic gives an overview of the basic strategies for the average person to use in the event of a zombie-related emergency.
Read the review of this infographic »
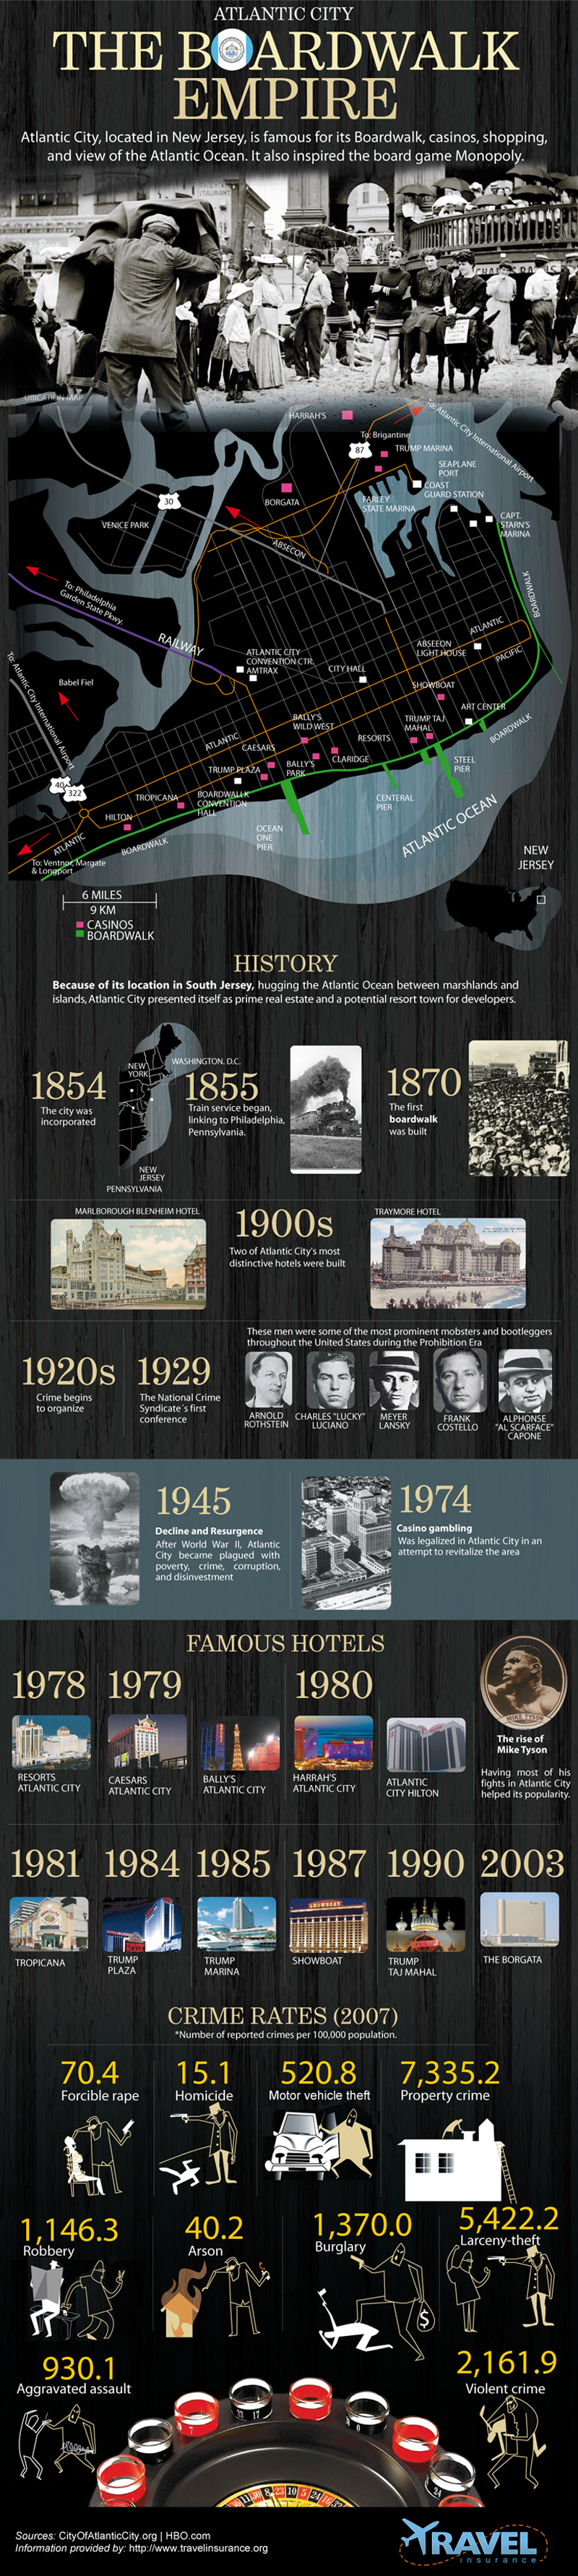
The Boardwalk Empire (TravelInsurance.org)
Posted by Simon in Society & Culture on August 19, 2011
What It Shows
This infographic gives somewhat of a geographical and historical overview of New Jersey’s Atlantic City and its “Boardwalk Empire”, whose prohibition-era antics inspired the recent HBO hit of the same name. It’s more than just the game Monopoly.
Read the review of this infographic »
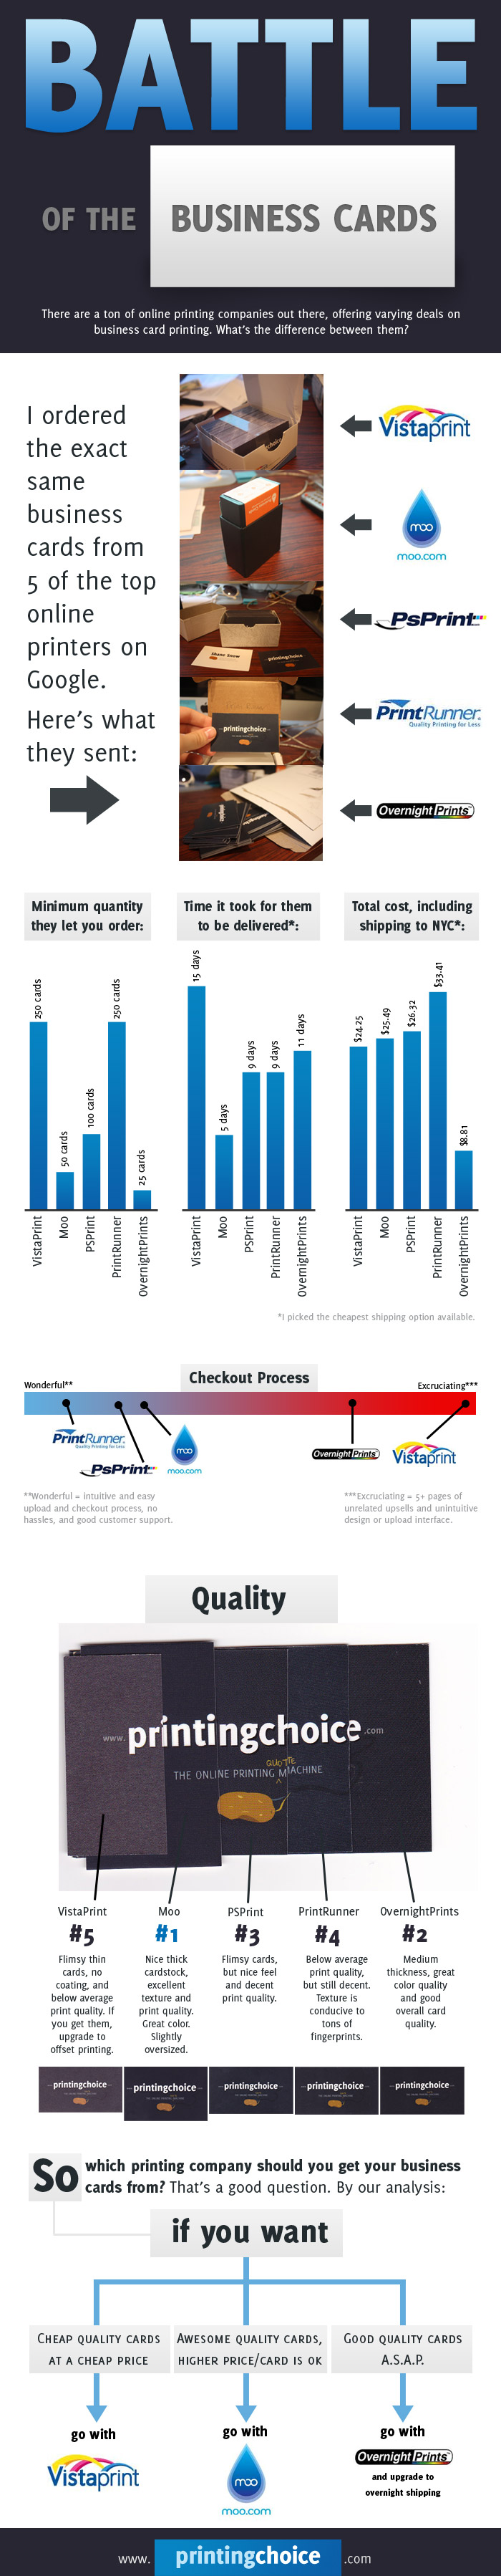
Battle of the Business Cards (Printing Choice)
What It Shows
This infographic compares a seemingly equal business card purchasing process across 5 top online business card printing services, comparing cost, delivery time, quality, and other factors.
Read the review of this infographic »
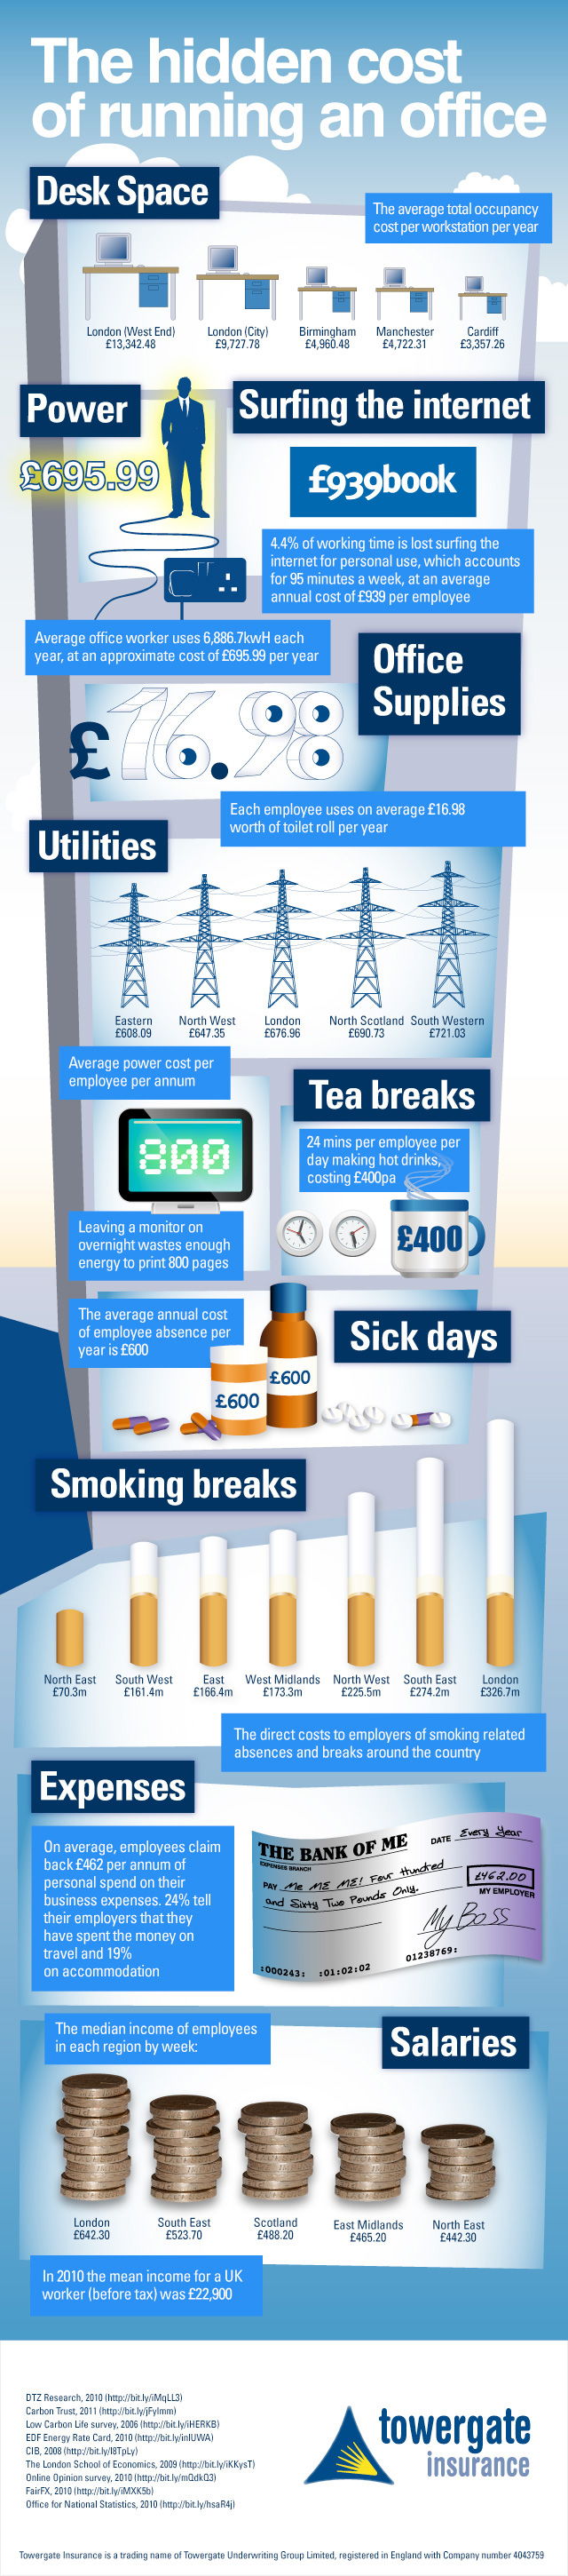
The Hidden Costs of Running a Business (Towergate)
What It Shows
This infographic shows the different ways businesses cost more than managers and owners expect, with UK figures for desk space, power, employee web surfing, office supplies, utilities, tea breaks, sick days, smoking breaks, expenses, and salaries.
Read the review of this infographic »
Facebook vs Google Plus (Jason Delodovici)
Posted by Simon in Science, Technology, & Internet on July 26, 2011

What It Shows
This infographic gives a snapshot of the current battle between the reigning social network heavyweight champion, Facebook, and the charging upcoming force that is Google+, seemingly ready to take a shot at the title.
Read the review of this infographic »
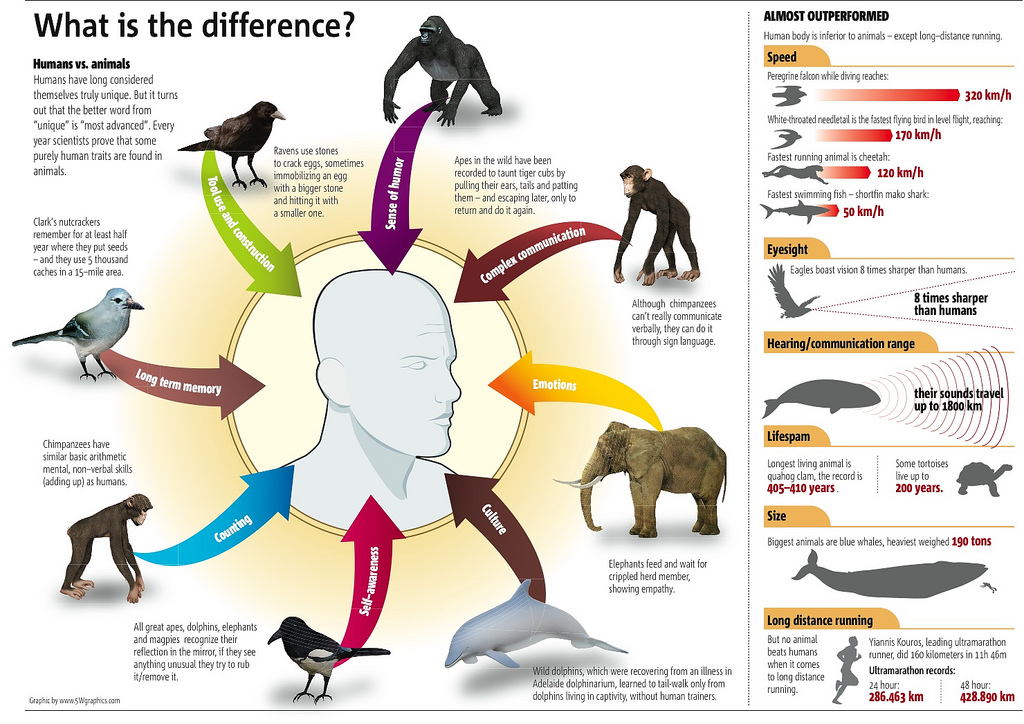
What Is The Difference? (Metrobest)
Posted by Simon in Psychology, Society & Culture on July 20, 2011
What It Shows
This infographic shows that despite our feelings of arrogance, in many ways humans are not more special than other animals, by showing the traits we share: tool use, long term memory, counting, self awareness, culture, emotions, complex communication, and sense of humor.
Read the review of this infographic »
Transgender (Charlie Rocket)
Posted by Simon in Society & Culture on July 6, 2011
![]()
What It Shows
This infographic breaks down statistics associated with transgendered people, including the percentage of the population who are transgendered, numbers for abuse and self abuse, and more.
Read the review of this infographic »
Lucid Dreaming (Oneironautics)
Posted by Simon in Psychology on June 28, 2011

What It Shows
This infographic visually explains strategies to help a person in their quest for lucid dreaming, where a dreamer is aware that they are dreaming while dreaming. As a person who has failed at this for years, it’s not as easy as it sounds. Even if you realize you’re dreaming, many people find that the excitement of this realization wakes them up. This infographic helps improve your odds for success, granting you conscious access to a new space with more flexible physics and reality control.
Read the review of this infographic »