Archive for December, 2011
The Game of Life (Lifebroker)

What It Shows
This infographic presents numerous facts and figures about life insurance, with an Australian focus.
Read the rest of this entry »
Mapping America (Matthew Block, Shan Carter, Alan McLean)
Posted by Simon in Society & Culture on December 4, 2011
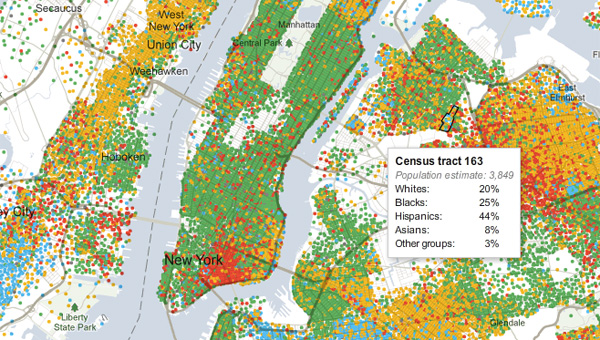
What It Shows
This interactive infographic lets you visually explore race, ethnicity, income, home value, and education level – census data, basically – across block of every city in the US. Seriously. Color-coded for easy big picture, mouse over a given block for its data.
Read the rest of this entry »