Archive for category Health & Safety
Getting Over Acne (AcneTreatment)
Posted by Simon in Health & Safety on March 31, 2012
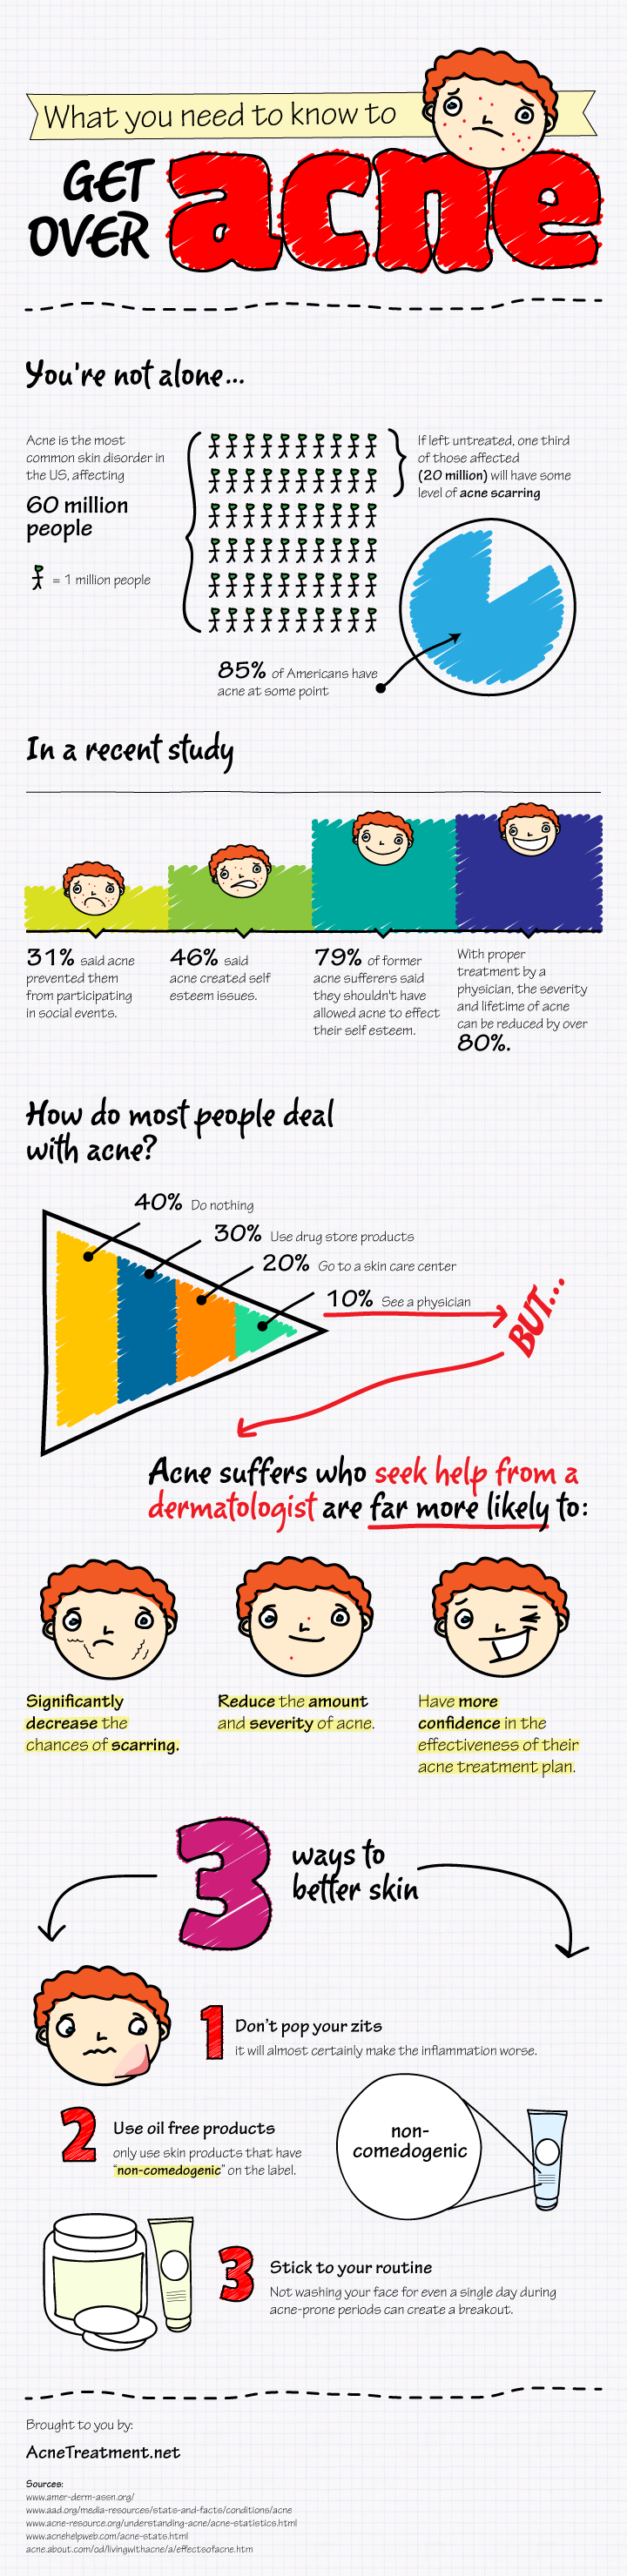
What It Shows
This infographic gives an overview of acne suffering, people’s psychological relationships with acne, and treatment statistics.
Read the rest of this entry »
Who’s Most Prone to Insomnia (Canada Drug Center)
Posted by Simon in Health & Safety on February 15, 2012
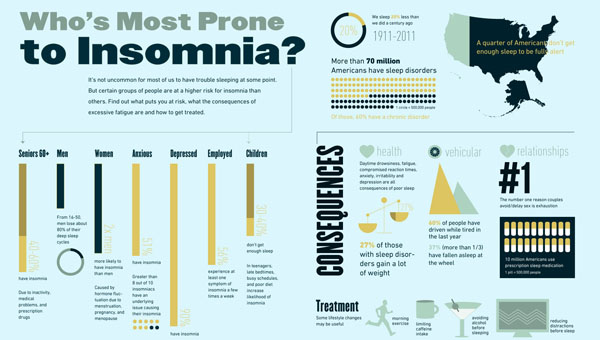
What It Shows
This infographic presents a collection of statistics to do with sleeping disorders, insomnia in particular, and how it tends to be treated.
Read the rest of this entry »
Japan Earthquakes 2011 Visualization Map
Posted by Simon in Health & Safety on February 4, 2012
What It Shows
This video infographic shows the map of Japan and marks the locations of 2011’s earthquakes. The magnitude of each earthquake is expressed in the size of the circle marking its location. It’s impossible to not react when the big one hits.
Read the rest of this entry »
Survival in the Event of a Zombie Attack (Z.E.R.O.)
Posted by Simon in Health & Safety on August 25, 2011
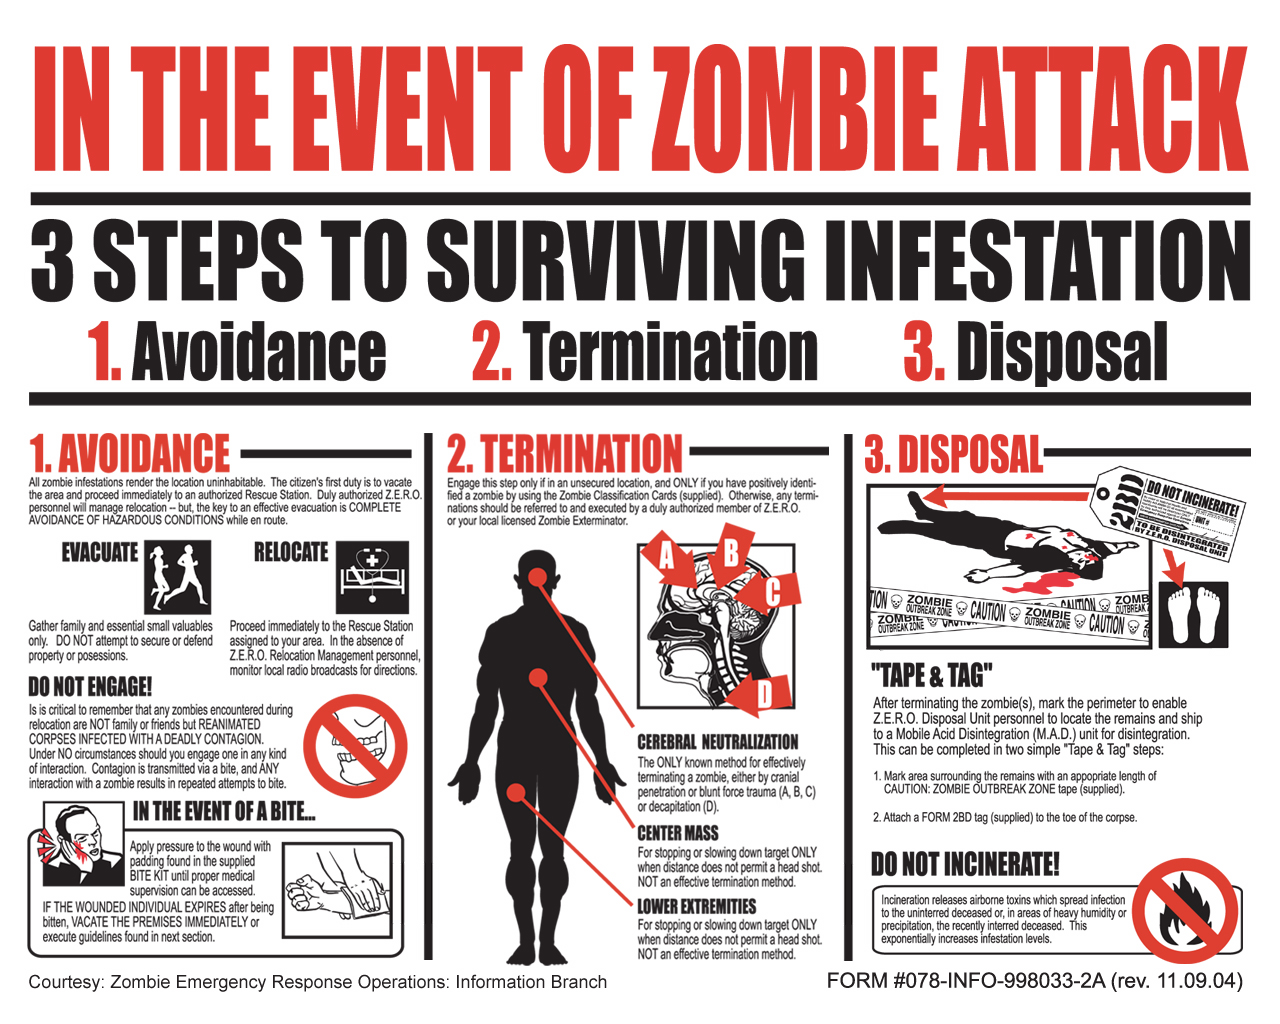
What It Shows
This infographic gives an overview of the basic strategies for the average person to use in the event of a zombie-related emergency.
Read the rest of this entry »
Chilean Miners Rescue (Andrew Blenkinsop & Michael Agar)
Posted by Simon in Health & Safety on June 2, 2011
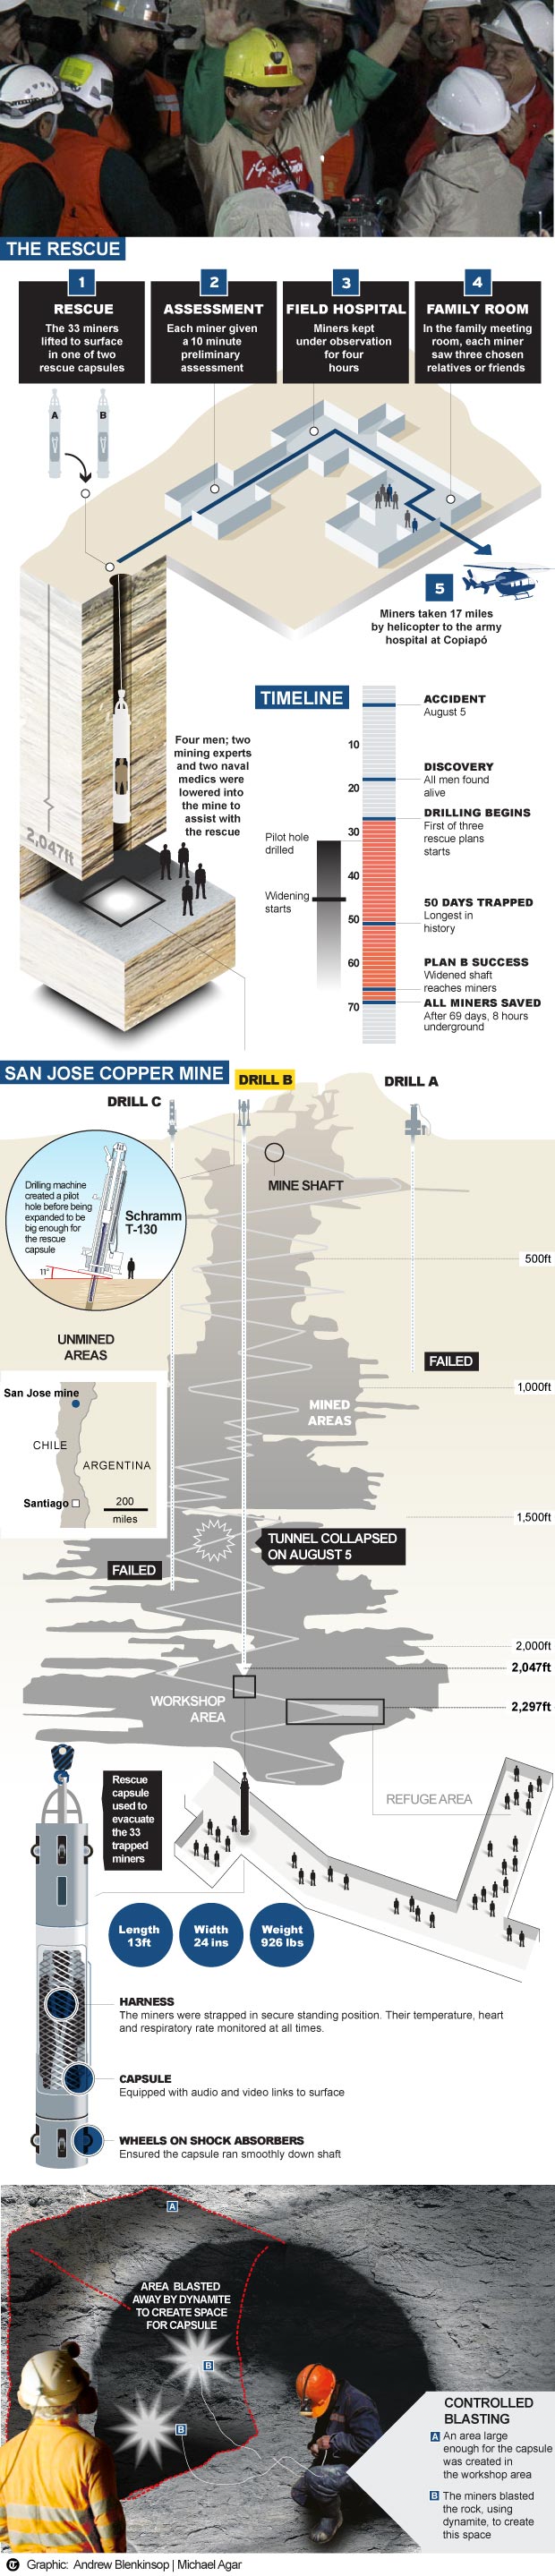
What It Shows
This infographic explains the steps, successes, and failures of the rescue of the miners in Chile in the late summer of 2010. I realize I’m somewhat late with this infographic, but I still like it, and just because a story isn’t fresh news doesn’t mean it’s not worth learning about or remembering.
Read the rest of this entry »
Up In Smoke (Good Magazine & Graham Roberts)
Posted by Simon in Health & Safety on May 27, 2010
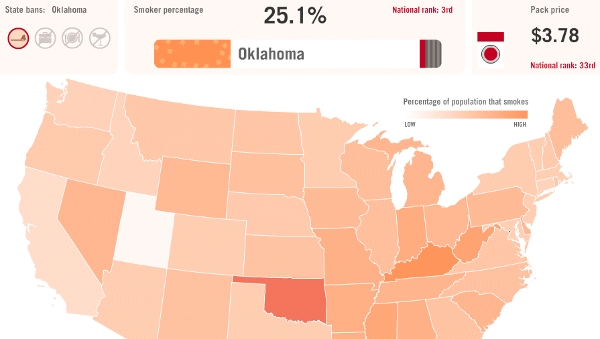
What It Shows
This interactive infographic gives an American state-by-state look at cigarette smoking popularity, prices, and bans.
Read the rest of this entry »
World Hunger by the Numbers (Online Schools)
Posted by Simon in Food & Drink, Health & Safety on April 8, 2010
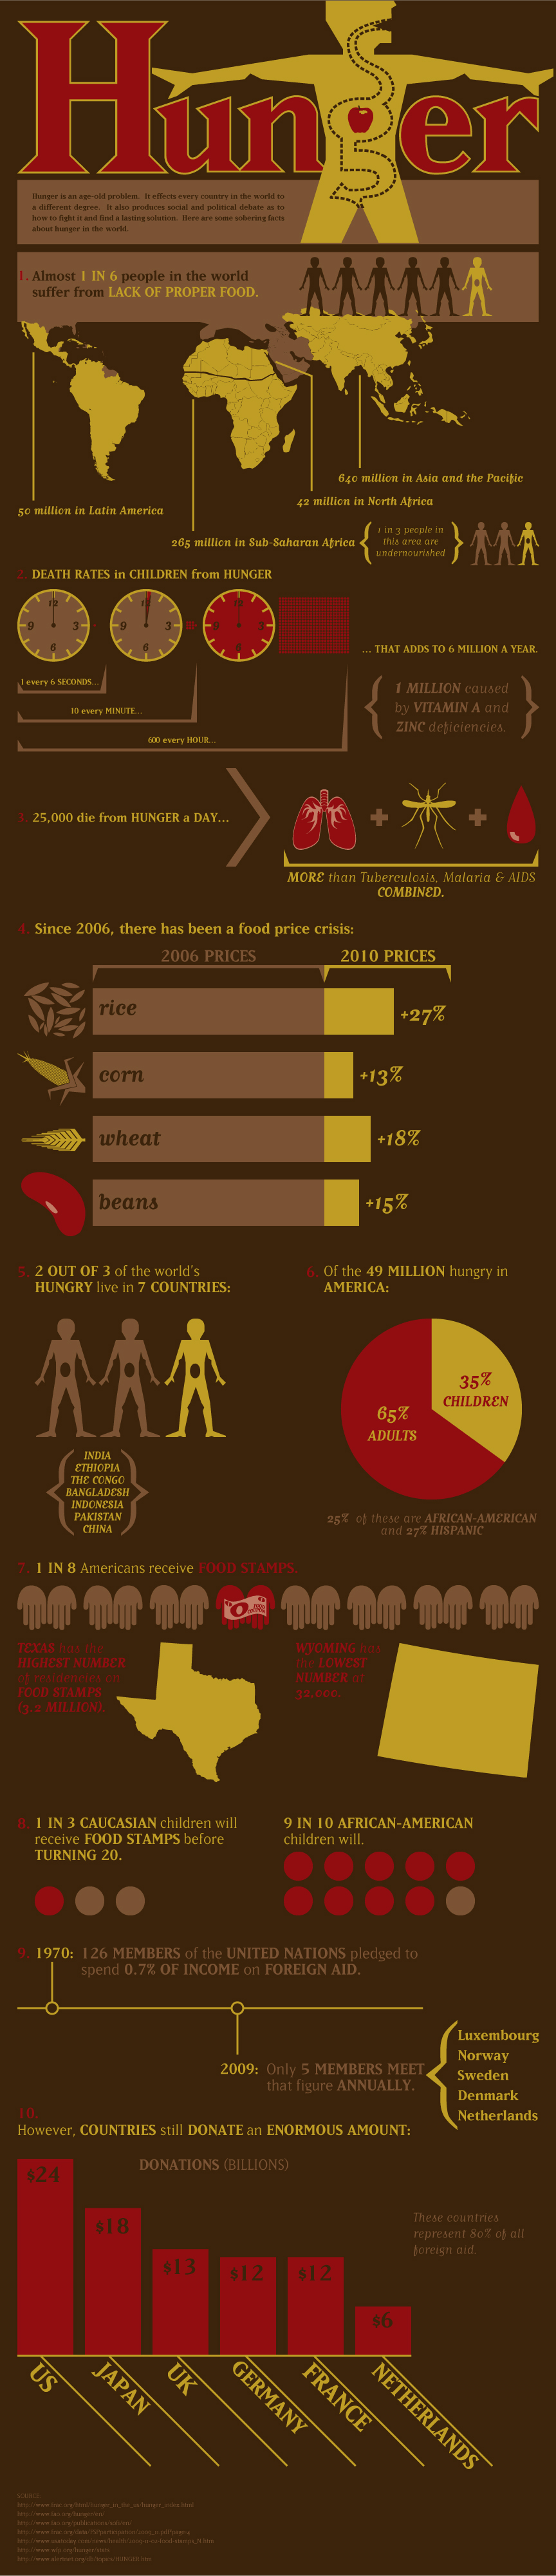
What It Shows
This infographic is presents a series of world hunger related facts. I normally let the infographic itself present the facts, but here are some doozies:
Read the rest of this entry »
Teen Pregnancy in America: Facts & Statistics (Online Ultrasound Schools)
Posted by Simon in Health & Safety, Society & Culture on April 1, 2010
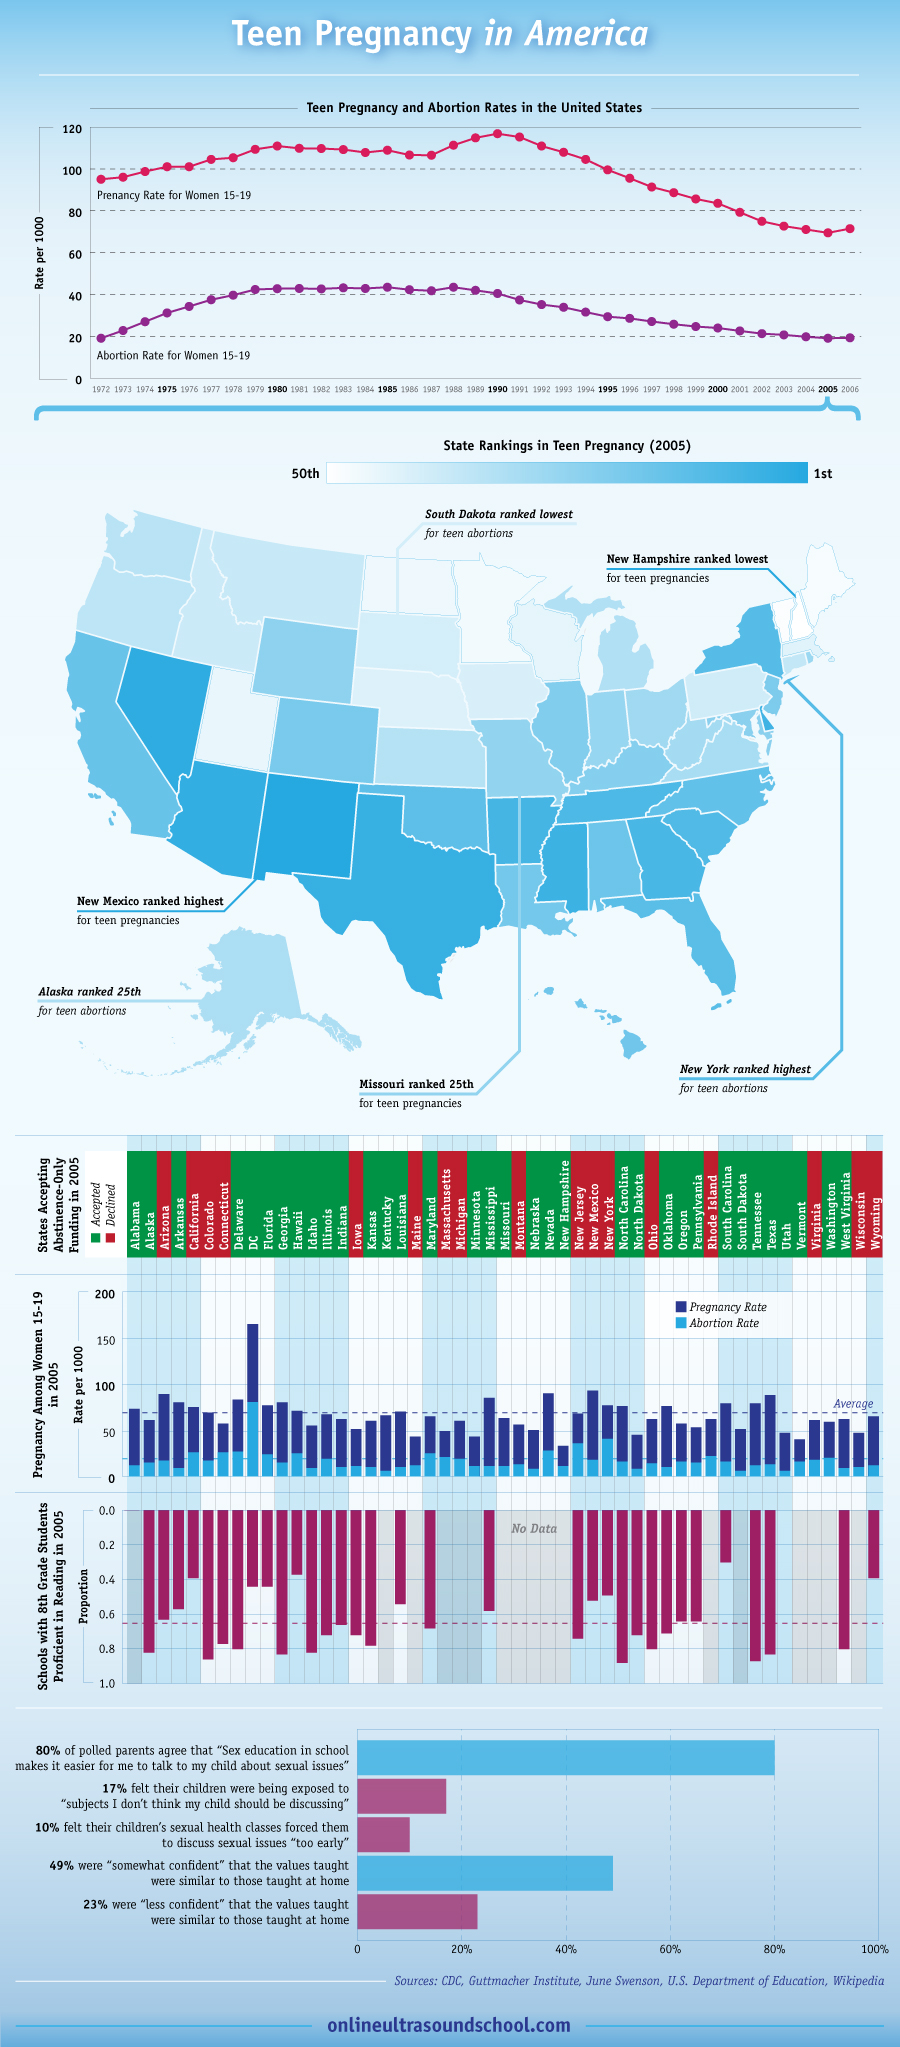
What It Shows
This infographic shows a collection of nationwide and state-level statistic on teen pregnancy and abortion rates in America. The map of America with different states highlighted by teen pregnancy rate rank gets more quantified in more detail in the graph below it.
Read the rest of this entry »
How You Can Live to 100 (EHM)
Posted by Simon in Health & Safety on February 27, 2010

What It Shows
A list of lifestyle decisions that can result in longer life expectancy, the stated goal being live to 100 years of age.
Read the rest of this entry »