Archive for October, 2009
Carland (Coleen Corcoran & Joe Prichard, Good Magazine)
Posted by Simon in Science, Technology, & Internet on October 22, 2009

What It Shows
A century of automotive history in the form of a game board. This inforgraphic covers environmental laws and innovations, new technologies, and the creation of the most significant cars in history.
Read the rest of this entry »
How Long Will It Last? (Armin Reller & Tom Graedel)
Posted by Simon in Environment & Nature on October 15, 2009
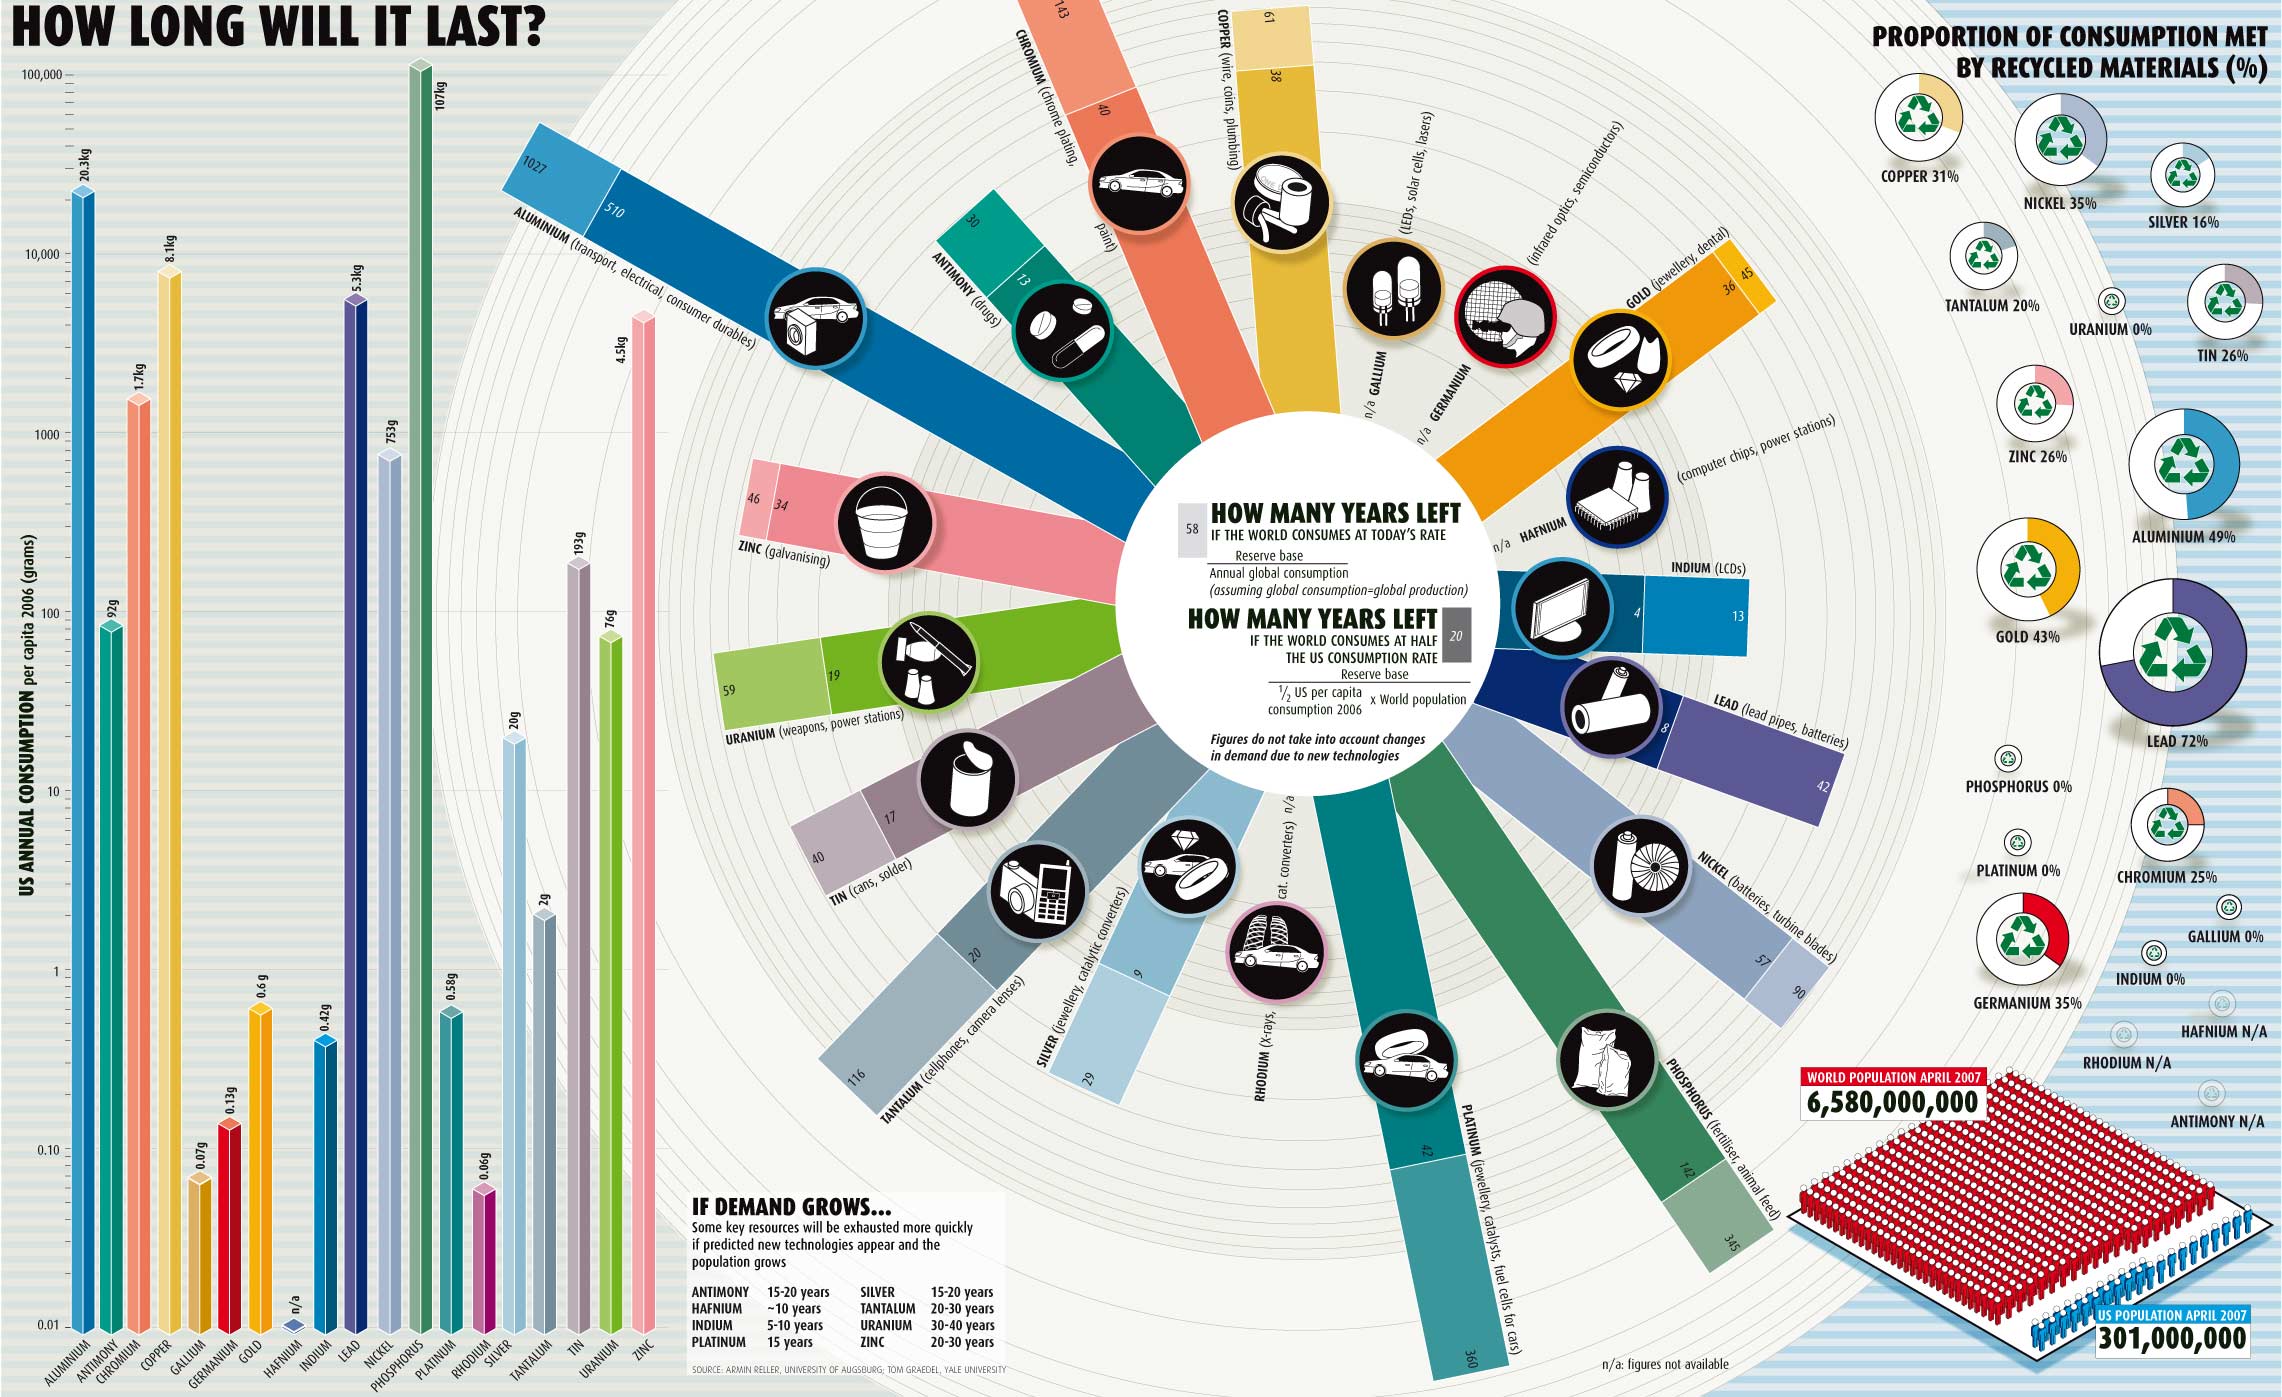
What It Shows
This environmental infographic shows consumption levels of various materials and relative timelines until we run out of them. It also shows the impact of American consumption, in particular, and makes the point by showing the even worse spot we’d be in if the world’s per capita consumption rate was just half that of the United States.
Read the rest of this entry »
Ebb and Flow of Movies (NY Times)
Posted by Simon in Entertainment on October 8, 2009

What It Shows
This fairly interactive infographic covers over 20 years (1986-2008) of revenue spikes from box office sales. Scroll or search for film names, and see the early spike and quick drop.
Read the rest of this entry »
Trilogy Meter (Dan Meth)
Posted by Simon in Entertainment on October 1, 2009
