Archive for February, 2012
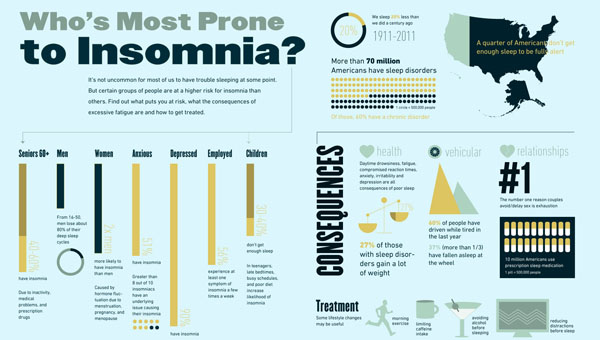
Who’s Most Prone to Insomnia (Canada Drug Center)
Posted by Simon in Health & Safety on February 15, 2012
What It Shows
This infographic presents a collection of statistics to do with sleeping disorders, insomnia in particular, and how it tends to be treated.
Read the rest of this entry »
Japan Earthquakes 2011 Visualization Map
Posted by Simon in Health & Safety on February 4, 2012
What It Shows
This video infographic shows the map of Japan and marks the locations of 2011’s earthquakes. The magnitude of each earthquake is expressed in the size of the circle marking its location. It’s impossible to not react when the big one hits.
Read the rest of this entry »