Archive for July, 2010
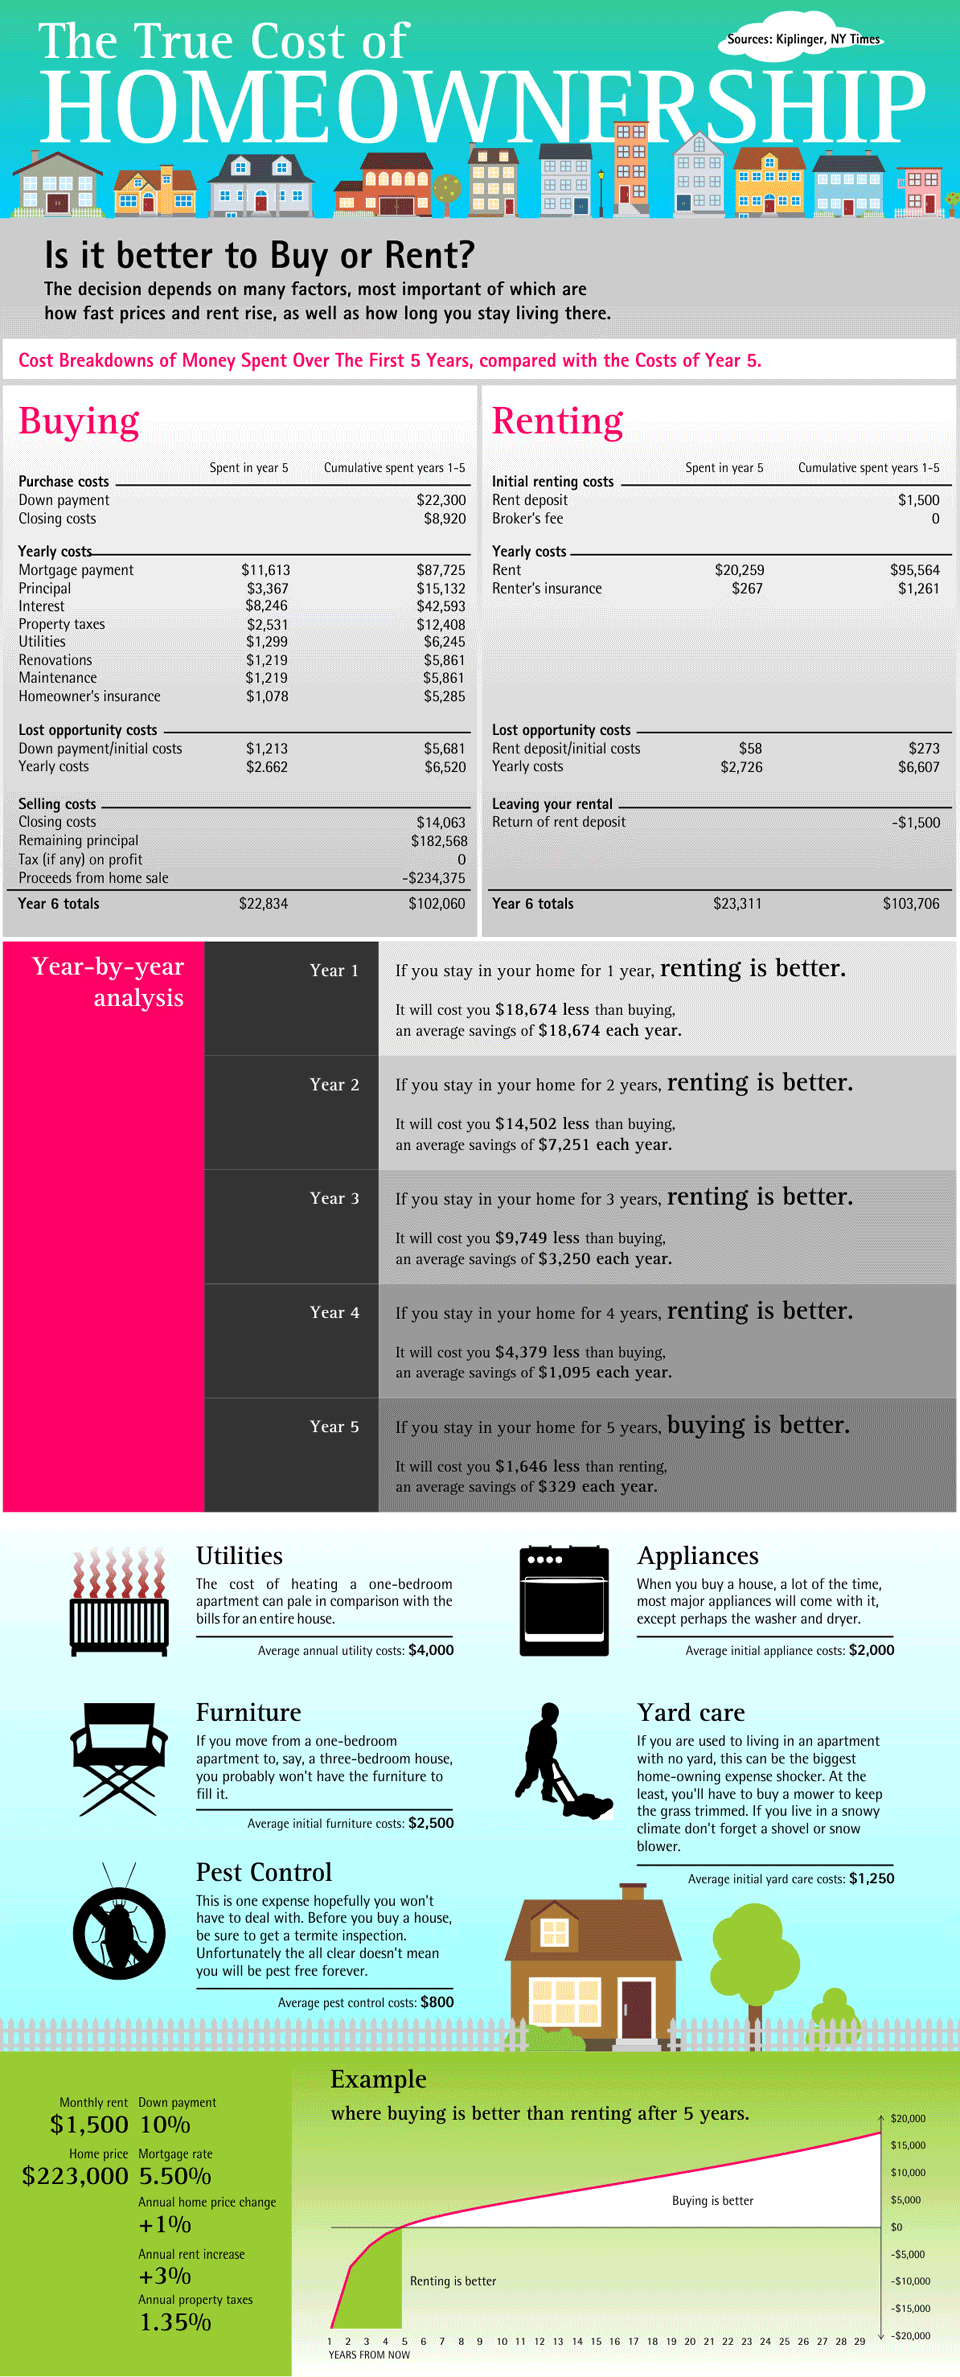
The True Cost of Homeownership (Moolanomy)
Posted by Simon in House & Home, Money on July 12, 2010
What It Shows
This infographic breaks down the factors associated with one of the perennial home questions: to buy, or to rent?
Read the rest of this entry »
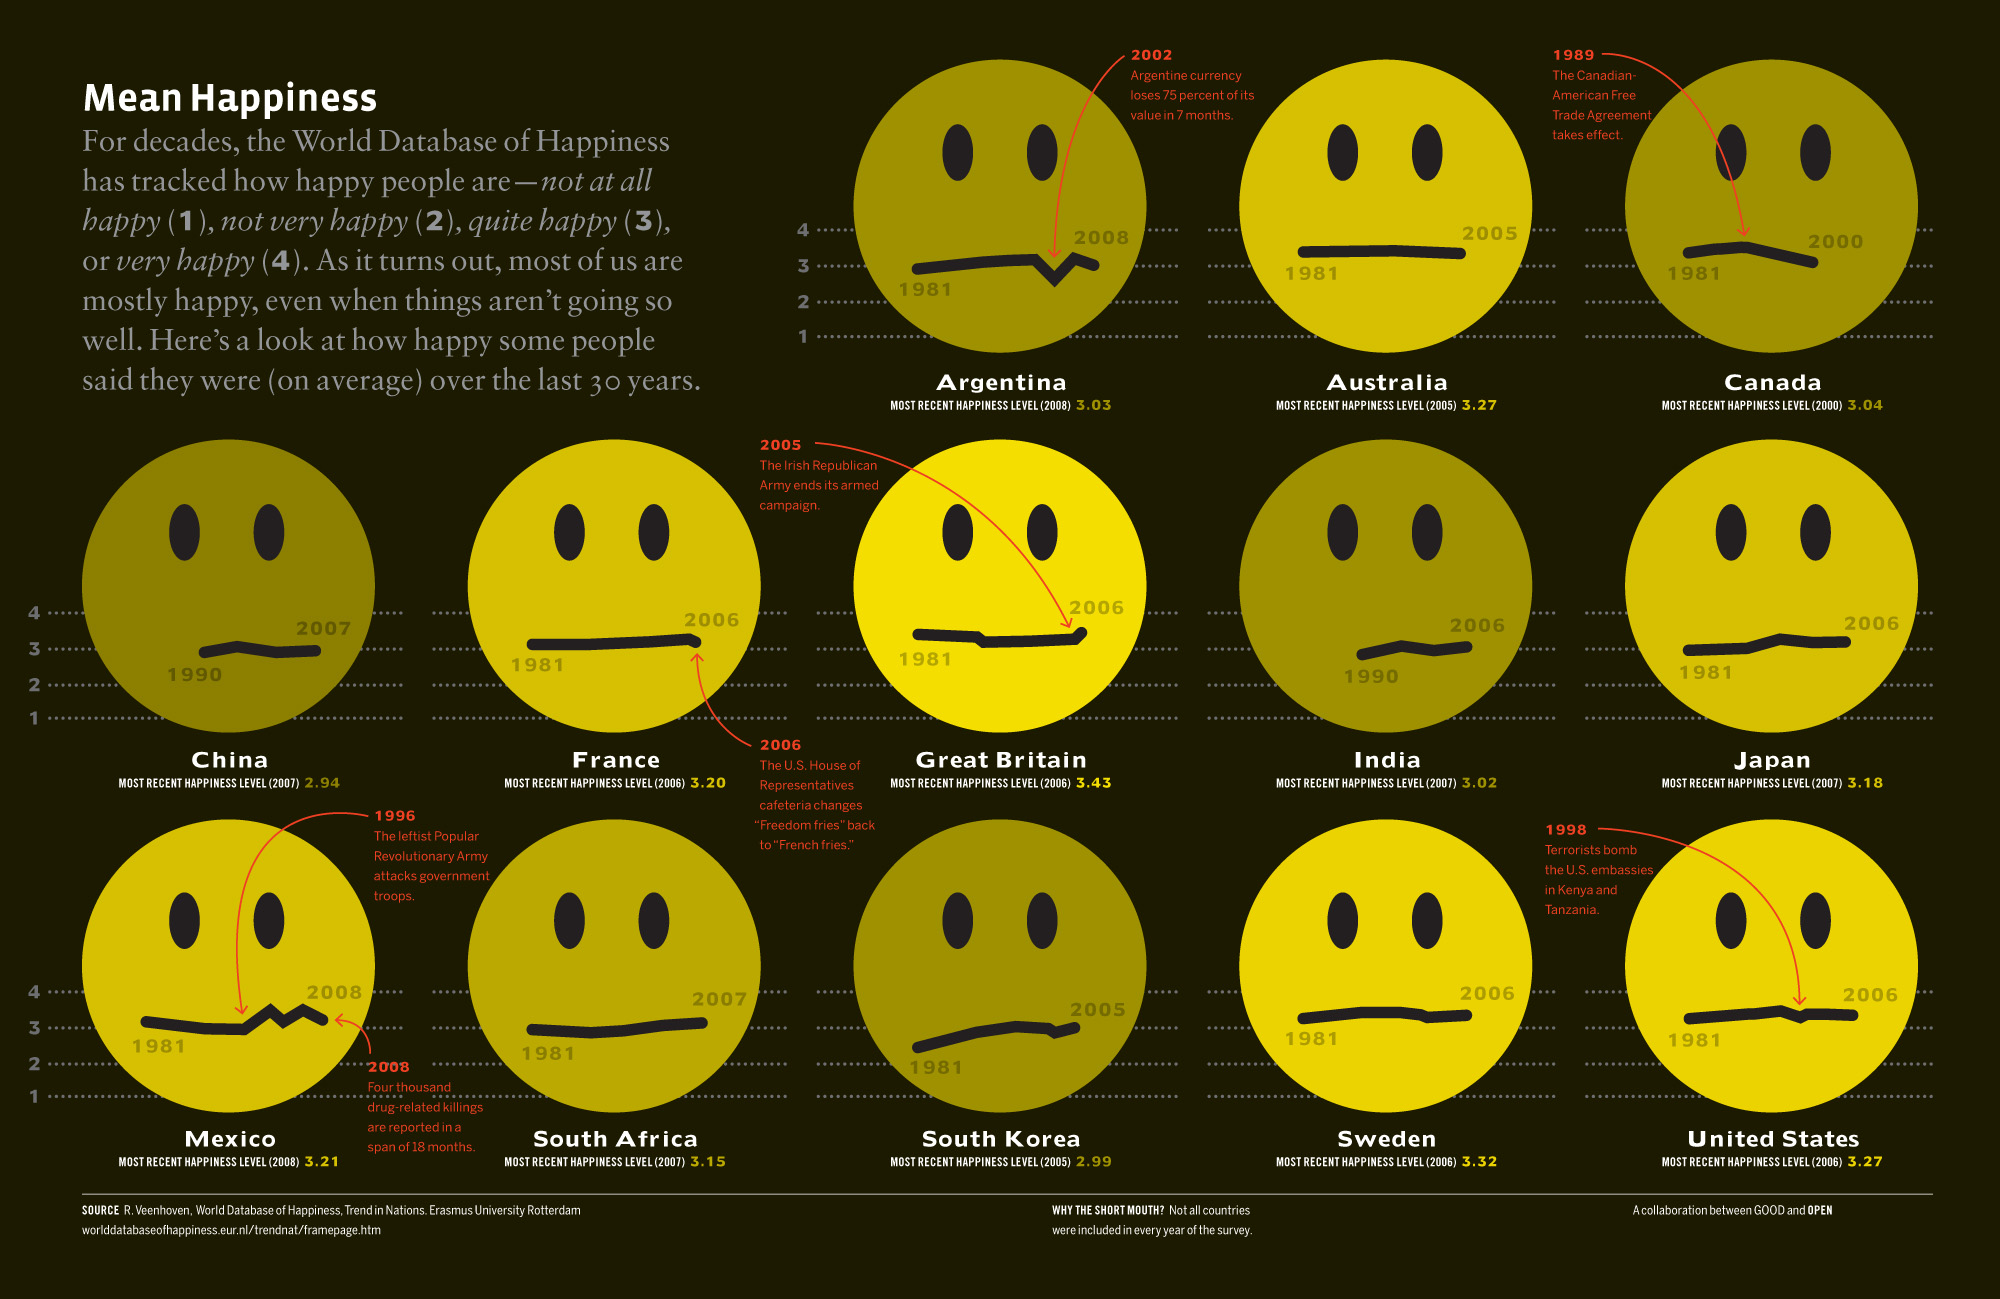
Mean Happiness (GOOD & Open)
Posted by Simon in Society & Culture on July 8, 2010
What It Shows
This infographic uses smiley faces to compare happiness levels between various countries.
Read the rest of this entry »
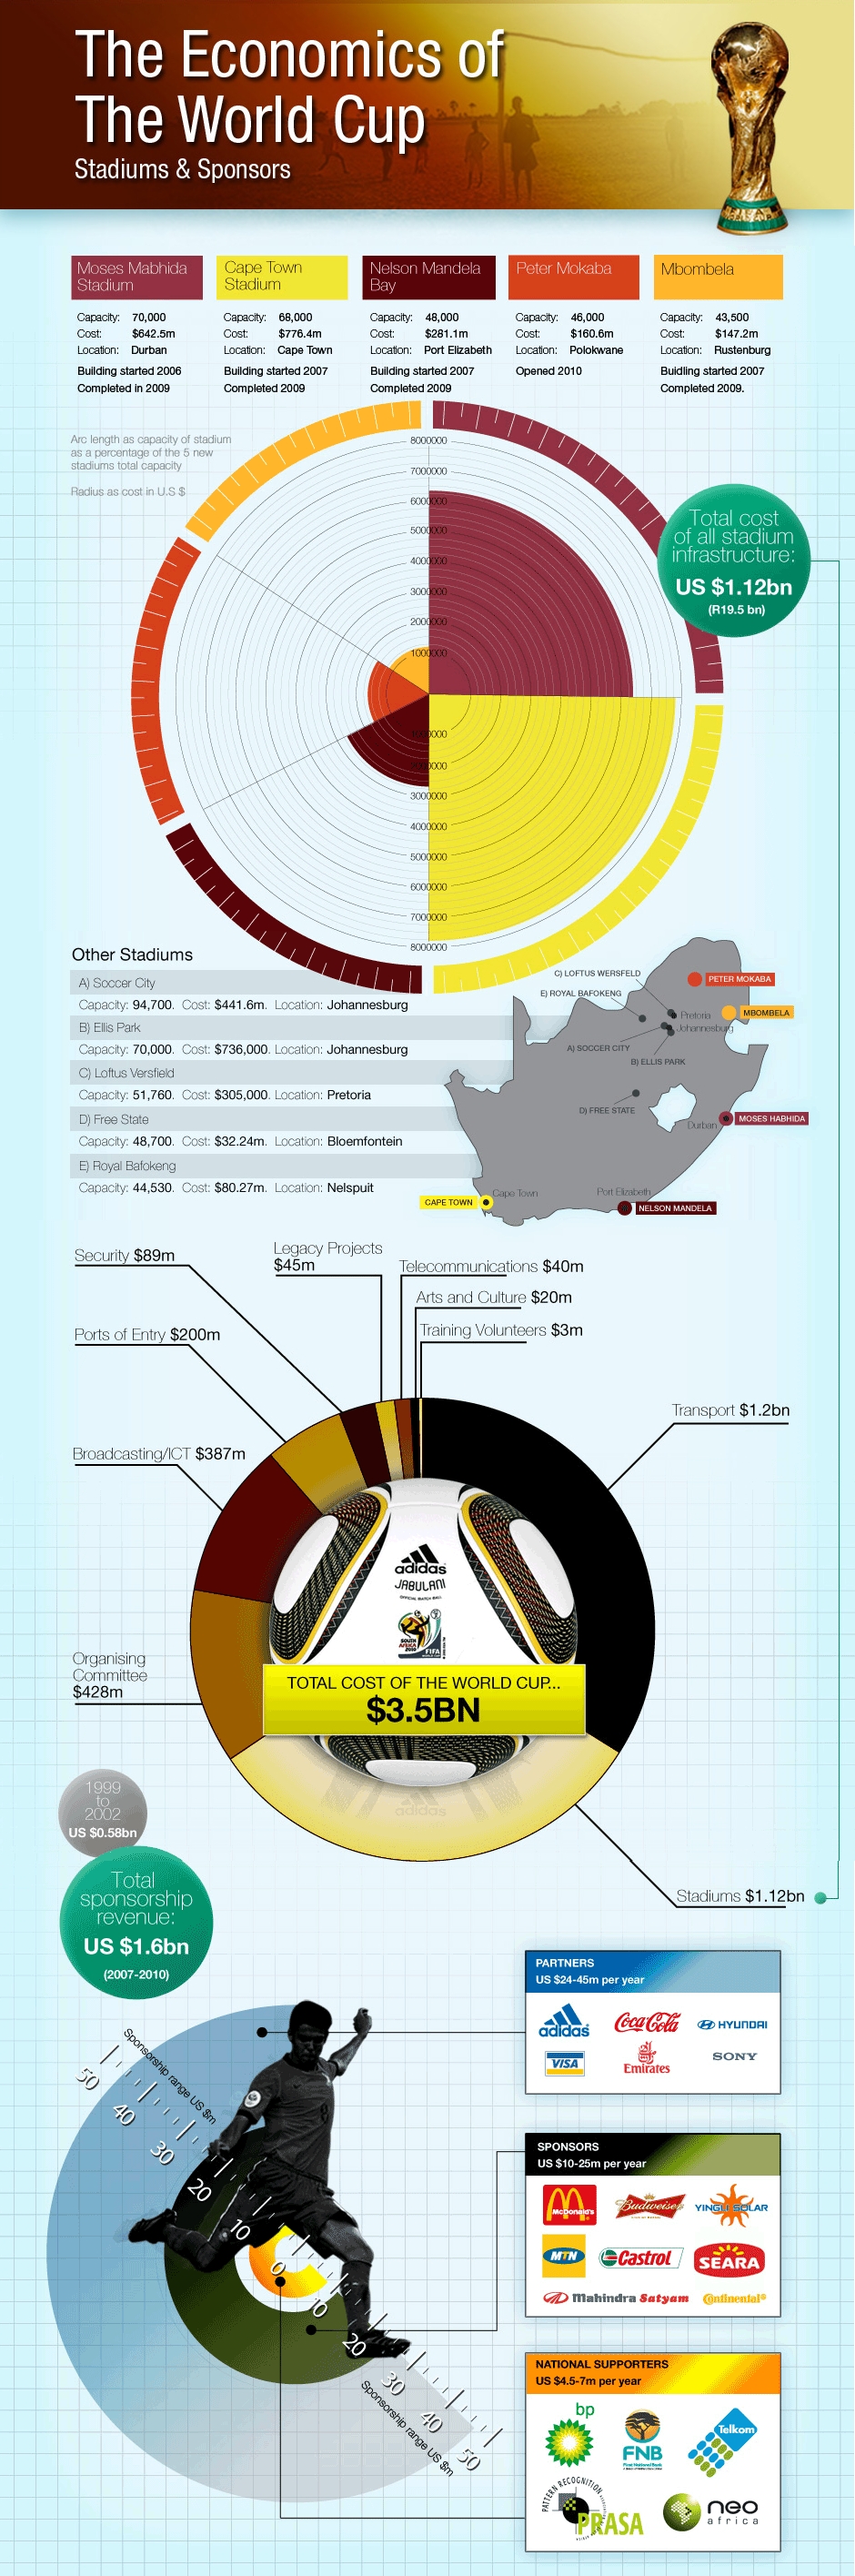
The Economics of the World Cup (Know Your Money)
What It Shows
This infographic shows an economic breakdown of the current World Cup tournament, including sponsorships, stadium costs, and more. Warning: it’s a large image!
Read the rest of this entry »
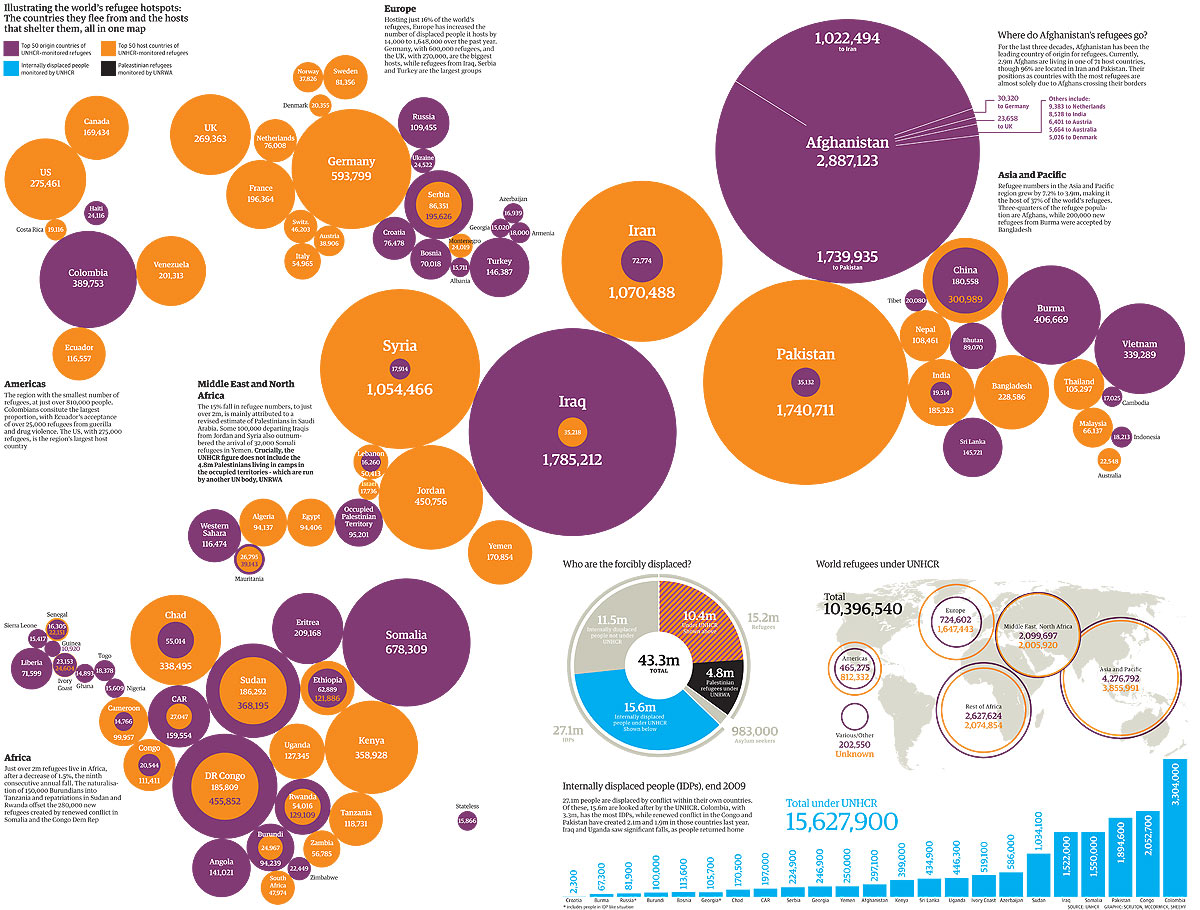
UNHRC Refugee Statistics (Scruton, McCormick, Sheehy)
What It Shows
This infographic mainly indicates the amounts of refugees leaving and entering countries around the world.
Read the rest of this entry »