Archive for category Sports
The Economics of the World Cup (Know Your Money)
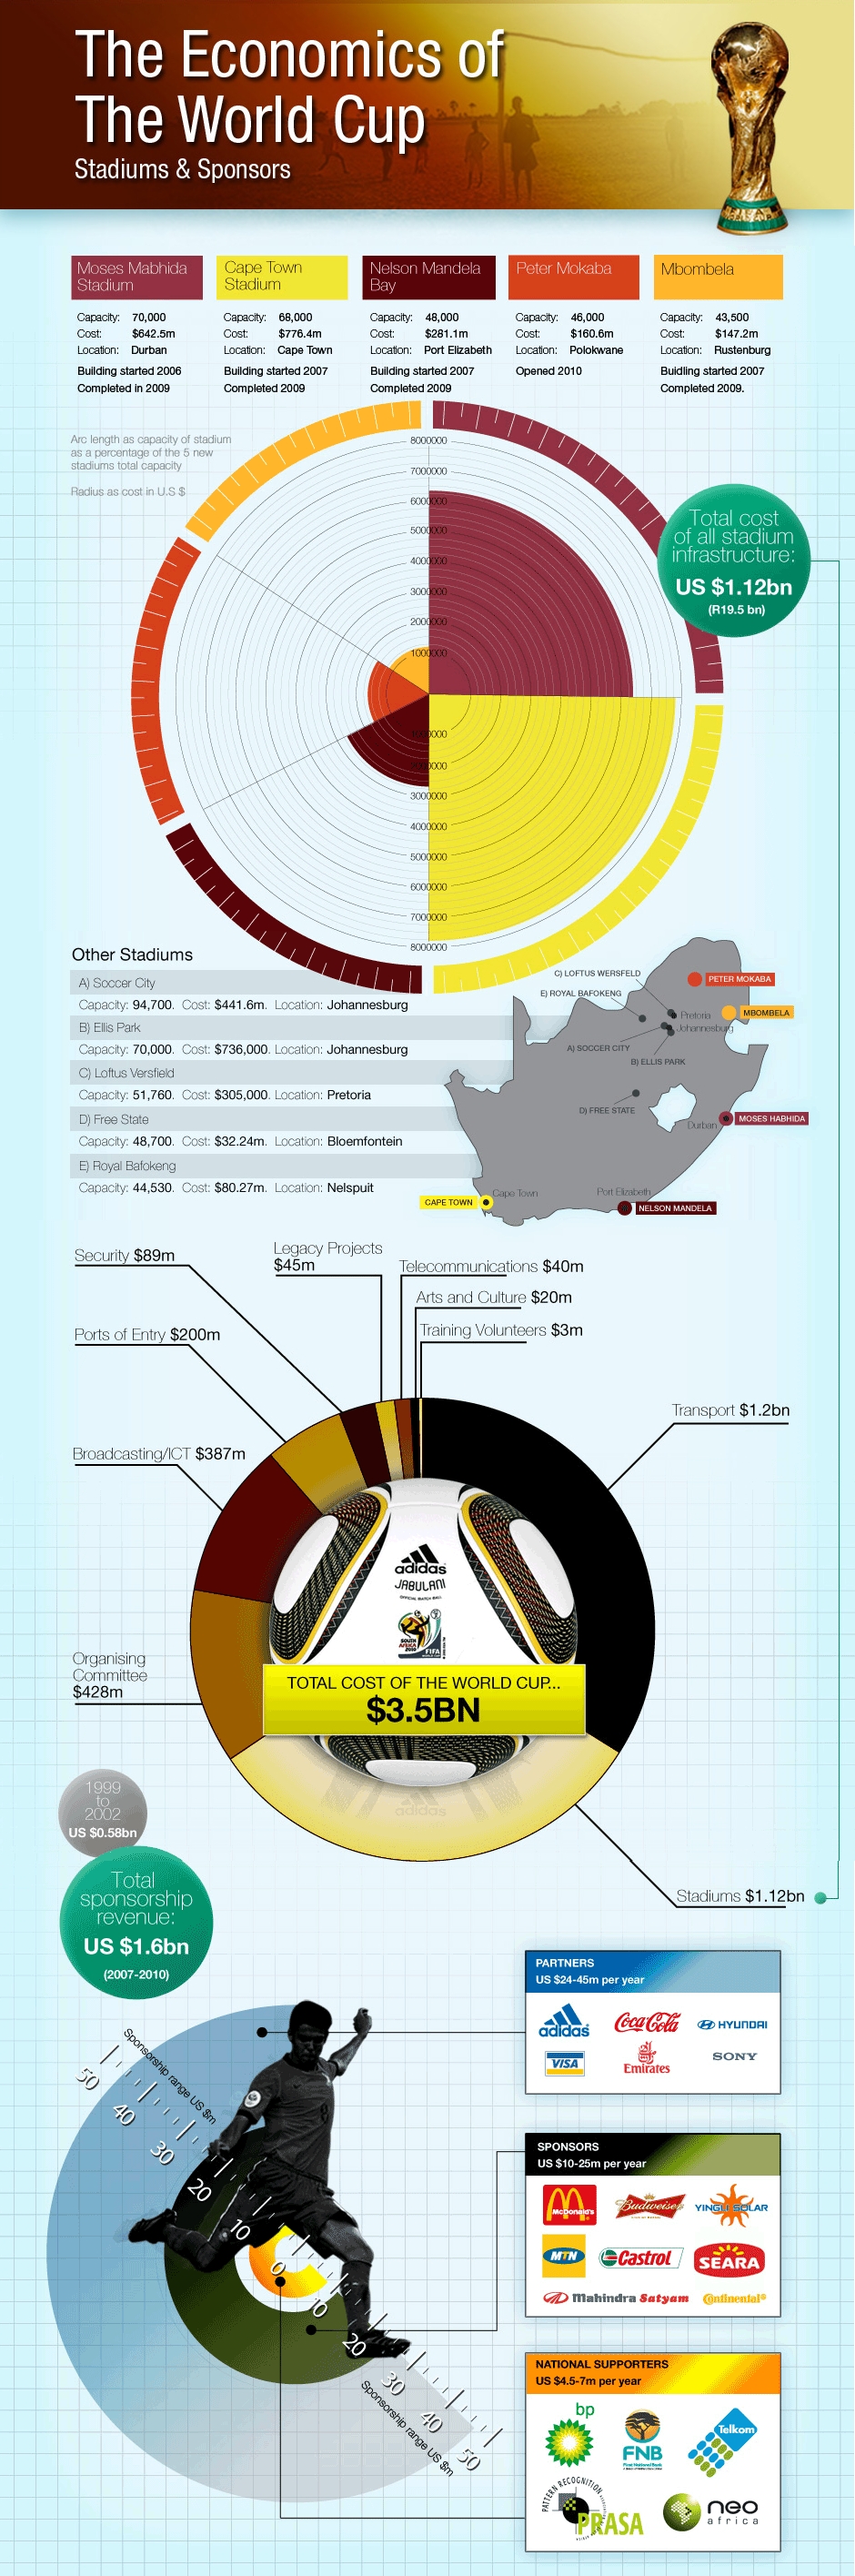
What It Shows
This infographic shows an economic breakdown of the current World Cup tournament, including sponsorships, stadium costs, and more. Warning: it’s a large image!
Read the rest of this entry »
Periodic Table of Professional Cycling (Cyclosm)
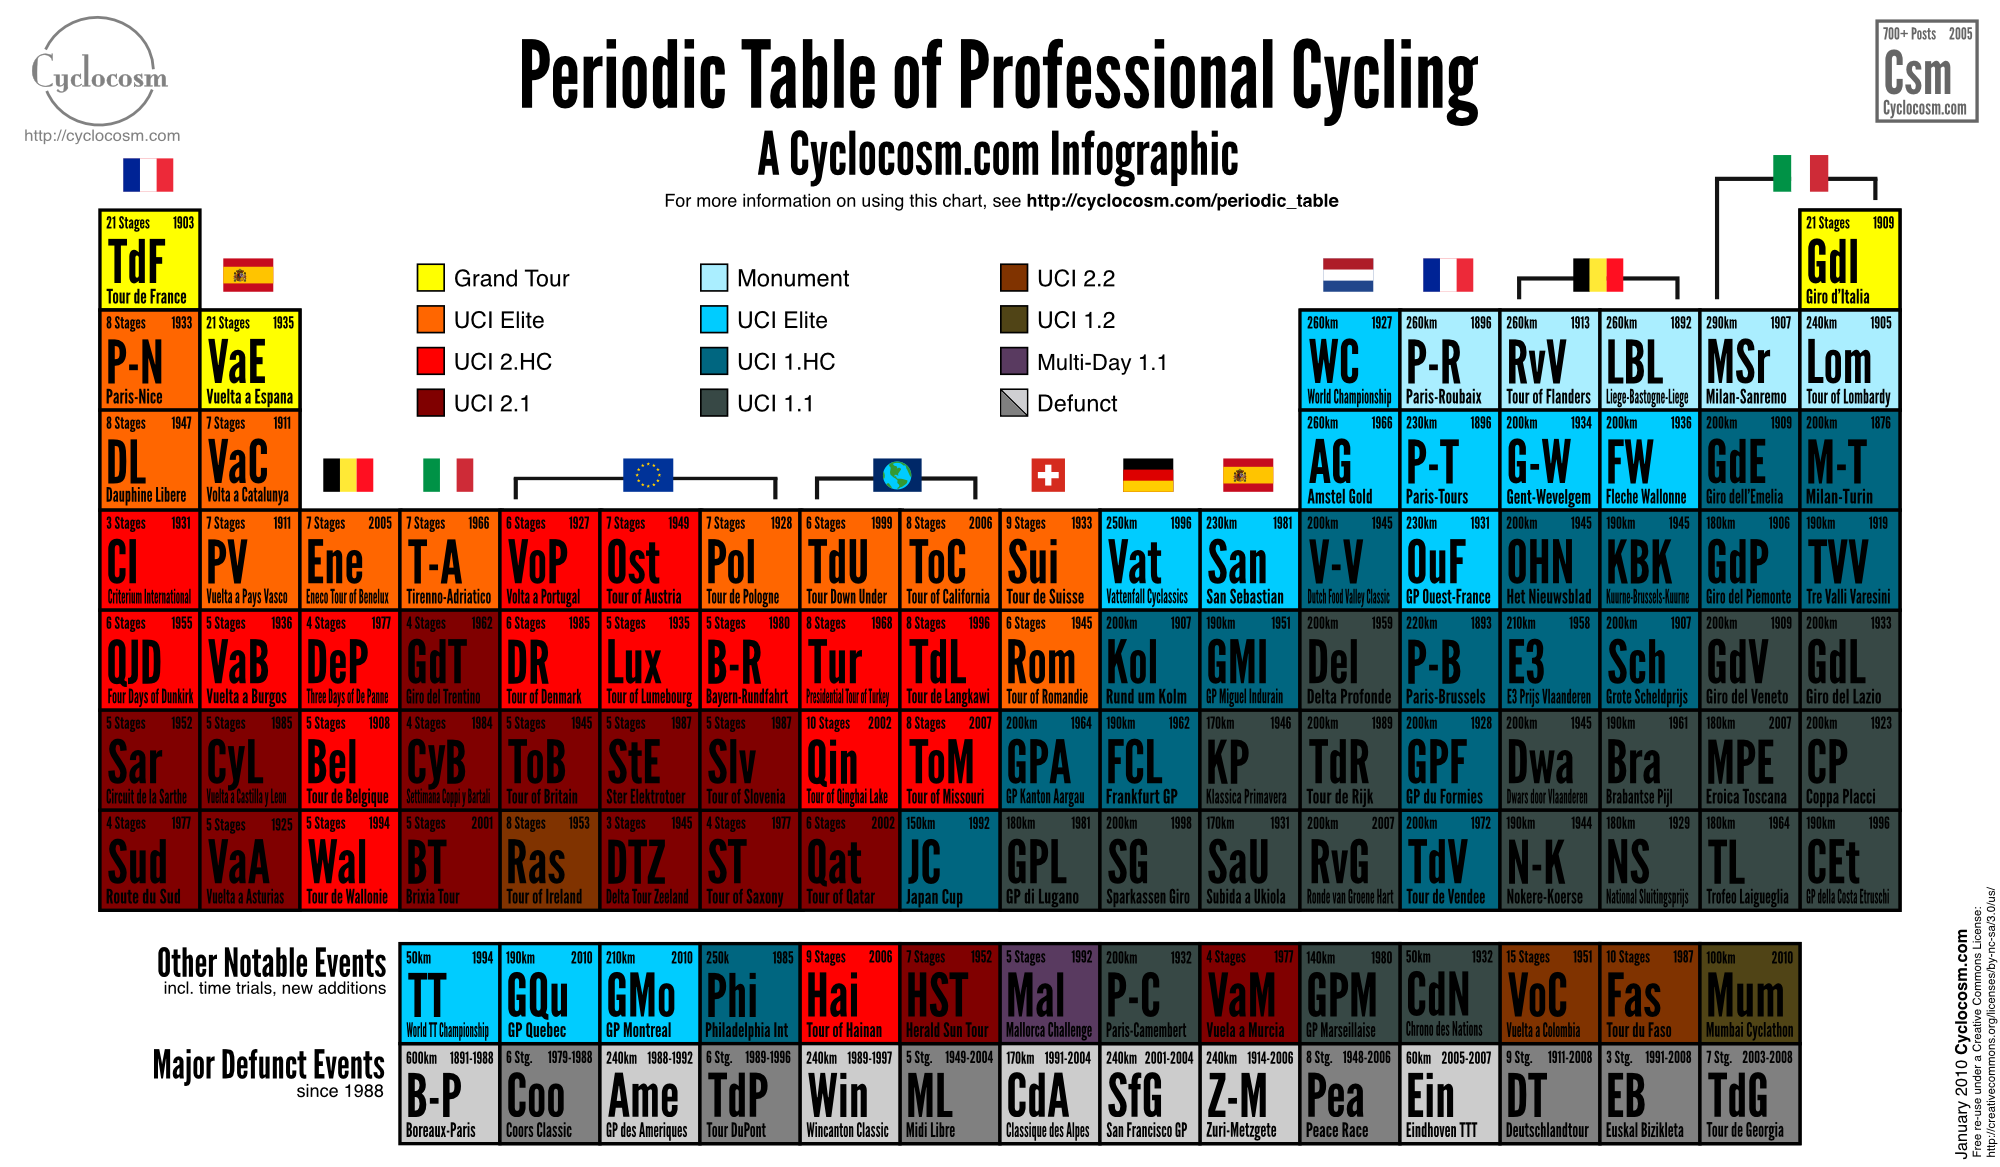
What It Shows
A complete breakdown of professional cycling events (eg. Tour de France) using the periodic table as the structural base. Rows indicate the prestige of the event, and columns represent host nations. Stage races tend to the left, single-day races to the right.
Read the rest of this entry »