Archive for category History
The Evolutionary Tree of Religion (Simon E. Davies)
Posted by Simon in History, Society & Culture on November 28, 2014
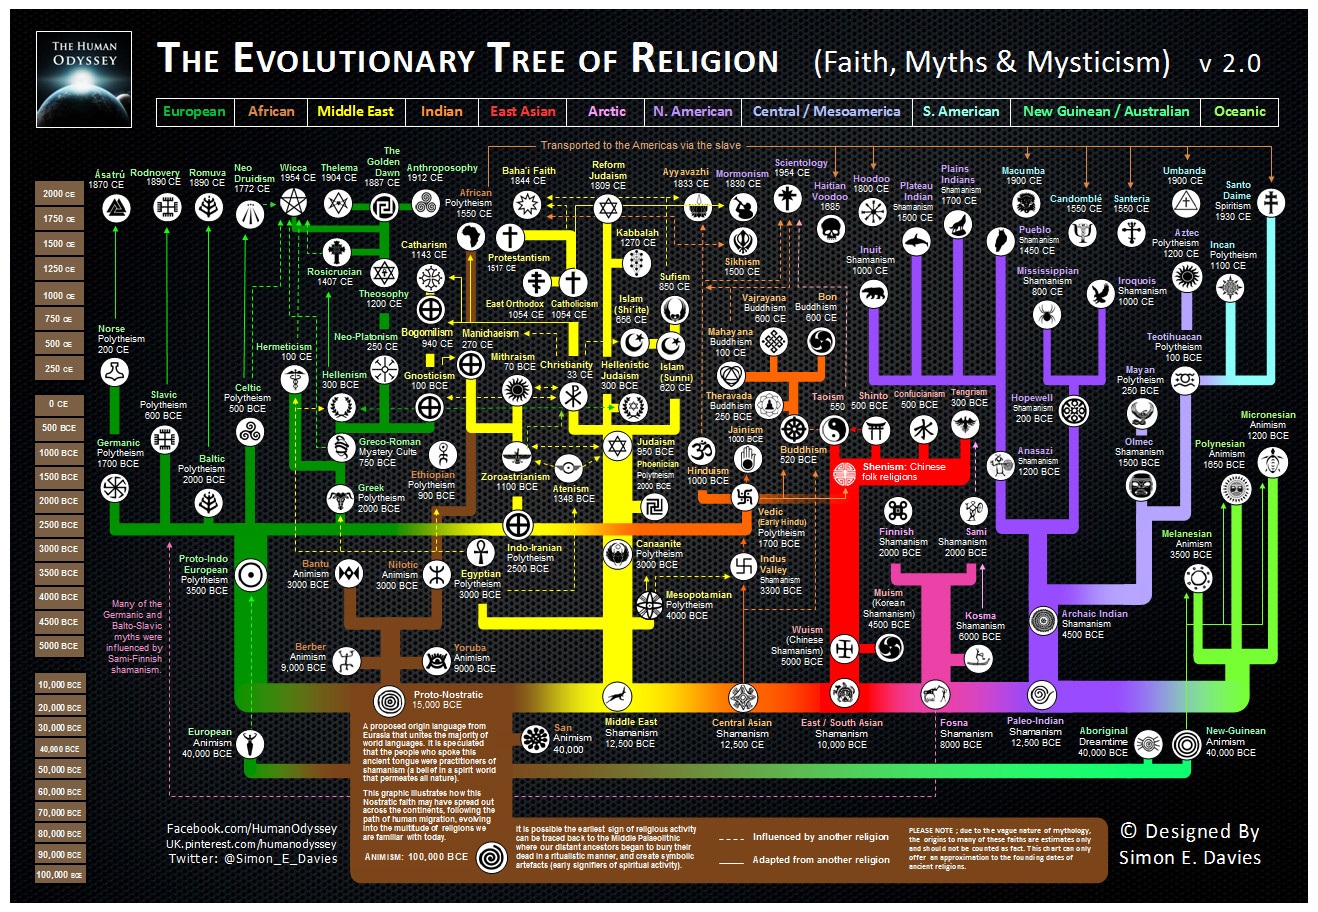
What It Shows
This is a timeline infographic mapping the evolution of various religious lines, organized geographically.
Read the rest of this entry »
“1945-1998″: Nuclear Bomb Detonations (Isao Hashimoto)
What It Shows
This infographic, with sound and visuals, presents the detonation of nuclear bombs around the world from 1945 to 1998. The first blip is the Manhattan Project‘s test, and the next two are Hiroshima and Nagasaki. Every video second represents a month in the historical timeline. The sounds indicate which country is responsible for the test.
Read the rest of this entry »
D-Day (5W Graphics)

What It Shows
This infographic shows and explains timelines, strategies, and map information about the famous D-Day invasion of World War II.
Read the rest of this entry »