Archive for June, 2011
Lucid Dreaming (Oneironautics)
Posted by Simon in Psychology on June 28, 2011

What It Shows
This infographic visually explains strategies to help a person in their quest for lucid dreaming, where a dreamer is aware that they are dreaming while dreaming. As a person who has failed at this for years, it’s not as easy as it sounds. Even if you realize you’re dreaming, many people find that the excitement of this realization wakes them up. This infographic helps improve your odds for success, granting you conscious access to a new space with more flexible physics and reality control.
Read the rest of this entry »
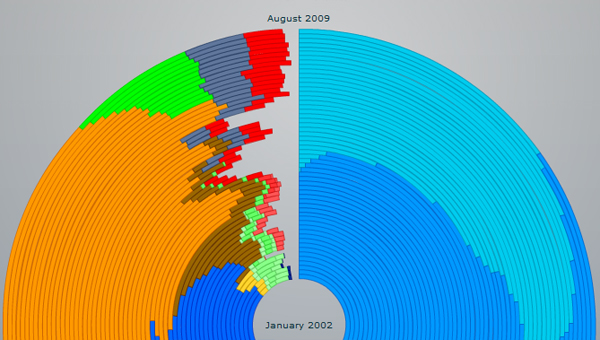
Historical Browser Statistics (Axiis)
Posted by Simon in Science, Technology, & Internet on June 22, 2011
What It Shows
This infographic tracks use of the various web browsers, visually representing market share across time.
Read the rest of this entry »
“1945-1998″: Nuclear Bomb Detonations (Isao Hashimoto)
What It Shows
This infographic, with sound and visuals, presents the detonation of nuclear bombs around the world from 1945 to 1998. The first blip is the Manhattan Project‘s test, and the next two are Hiroshima and Nagasaki. Every video second represents a month in the historical timeline. The sounds indicate which country is responsible for the test.
Read the rest of this entry »
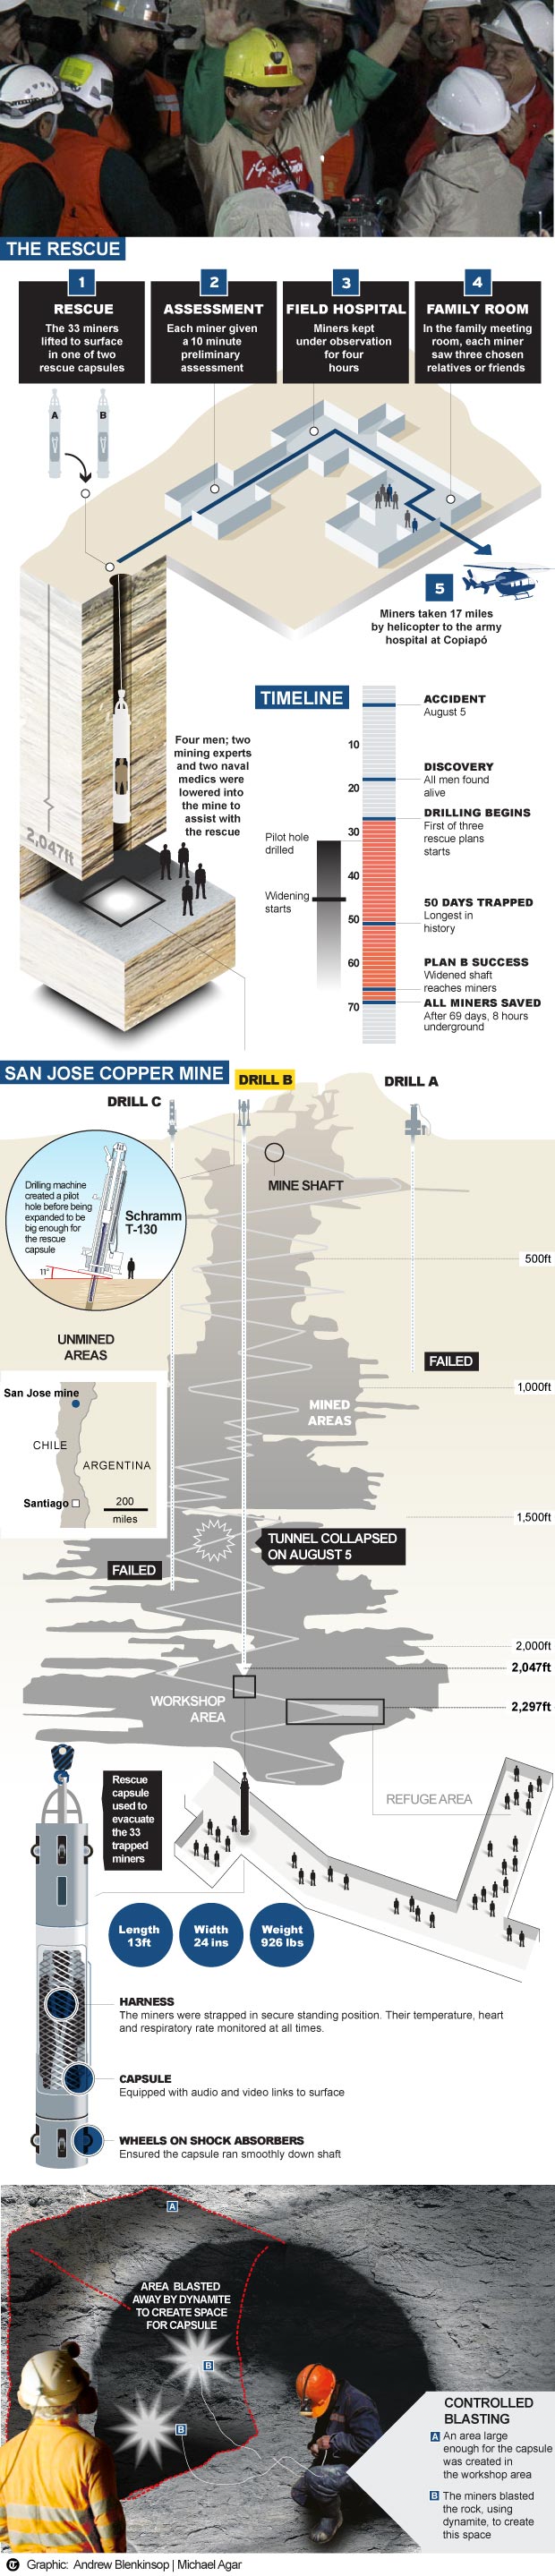
Chilean Miners Rescue (Andrew Blenkinsop & Michael Agar)
Posted by Simon in Health & Safety on June 2, 2011
What It Shows
This infographic explains the steps, successes, and failures of the rescue of the miners in Chile in the late summer of 2010. I realize I’m somewhat late with this infographic, but I still like it, and just because a story isn’t fresh news doesn’t mean it’s not worth learning about or remembering.
Read the rest of this entry »