What It Shows
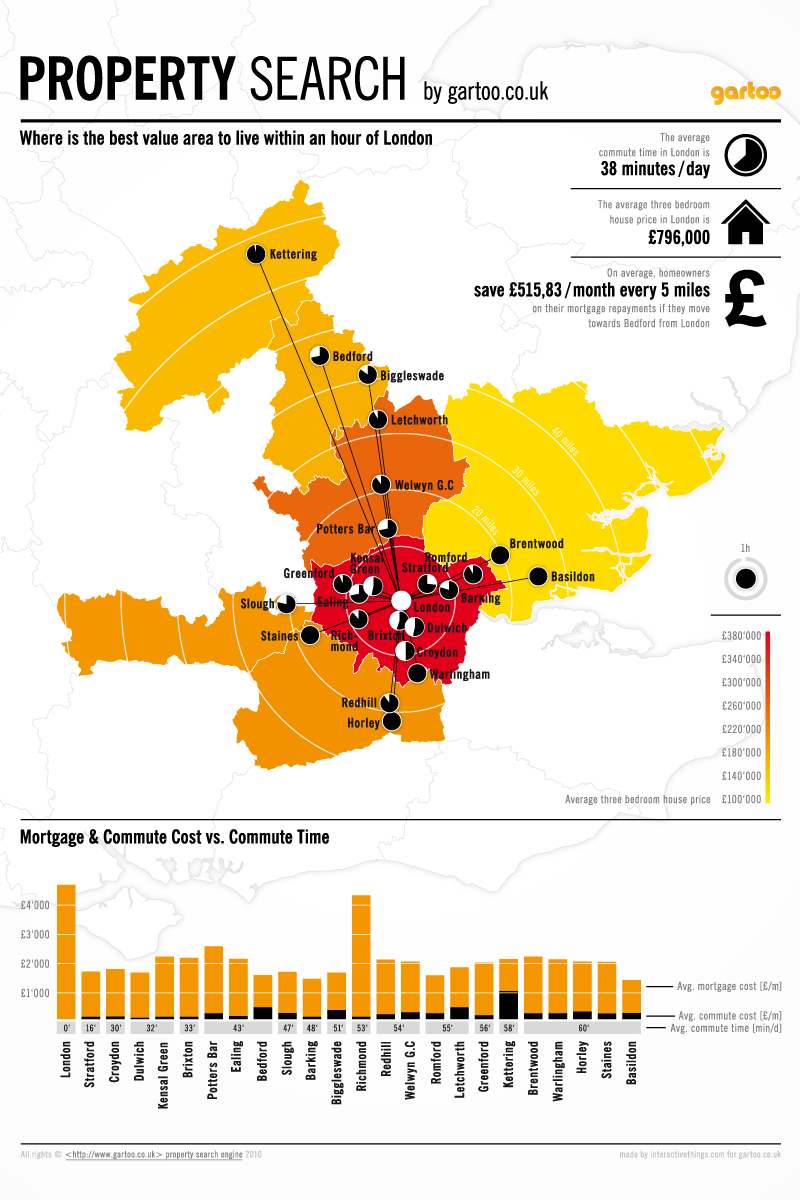
This infographic attempts to inform home buyers who want to avoid the astronomical housing costs of London’s real estate by comparing costs for areas outside London with the commute cost and time to come into the city.
Why It’s Good
I really like this infographic. Even if you don’t live in London or plan to any time soon, it’s a place people often end up. Plus, if you’re a traveling type (as I am), it’s always nice to know about overseas property.
The three data axes of commute time, commute cost (which essentially reflects distance), and housing cost are extremely well-meshed, making it really easy to get a sense of them for a given city and region.
The map alone would have already been handy, yet the bar graph at the bottom makes comparisons between cities even clearer, throwing in the commute cost that is somewhat implied in the map distances, but made explicit. The choice for how to display the data was very well-thought out. There is a lot of information, and yet you get no sense of redundancy. The makers were smart to set the hour-commute benchmark, since it’s not only a reasonable commute time range, but allows for the handy pie-like clock icons to save space and condense information without sacrificing clarity.
The facts at the upper right are a nice touch, too. When you’re given a range of quantities, it’s always helpful to have the average presented as your benchmark. Quirky side facts are fun, certainly, but it’s nicer when the side facts contribute to the message.
Infographics bother me when they don’t take advantage of the potential of color to add another layer of information while sprucing up the aesthetics, and I’m happy to say that this one succeeds beautifully in this respect.
What It’s Missing
While I respect the infographic letting people draw their own conclusions, some kind of data compiling summary would have been nice. For example, some kind of equation that shows which city has the best value of cost divided by commute time.
Still, there is enough in this infographic that that kind of summary isn’t completely necessary.
This infographic is found here.